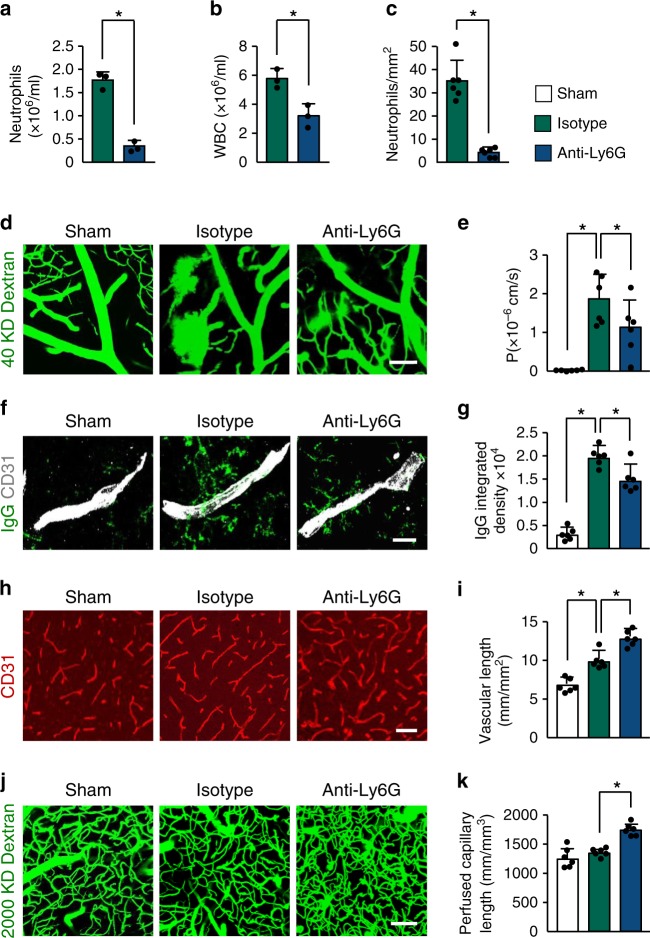
Fig. 2. Neutrophil depletion reduces BBB breakdown and increases neovascularization after stroke.
a, b Neutrophil and white blood cell counts in peripheral blood at 14 days after stroke in mice treated with control antibody or anti-Ly6G antibody (n = 3), unpaired two-tailed Student’s t-test was applied with *P = 0.0003 (a), *P = 0.012 (b). WBC, white blood cell. c Quantification of the number of neutrophils in the ischemic cortex at 14 days in mice treated with control antibody or anti-Ly6G antibody (n = 6 biologically independent experiments), Mann–Whitney test was applied with *P = 0.0022. d, e Representative in-vivo multiphoton microscopic images of intravenously injected FITC-dextran (MW = 40,000 Da; green) leakage in cortical vessels (d) at 14 days in sham-operated mice and ischemic mice treated with control antibody or anti-Ly6G antibody, and quantification of the permeability (P) product of FITC-dextran for each group (e) (n = 6). One-way ANOVA test was applied with *P = 0.0001 (Sham vs. Isotype), *P = 0.0354 (Isotype vs. Anti-Ly6G). Bar = 100 μm. f, g Representative confocal images (f) and quantitative analysis of IgG extravascular deposits (g) in the peri-infarct cortex at 14 days in sham-operated mice and mice treated with control antibody or anti-Ly6G antibody (n = 6). One-way ANOVA test was applied with *P < 0.0001 (Sham vs. Isotype), *P = 0.0041 (Isotype vs. Anti-Ly6G). Bar = 15 μm. h, j Representative confocal images (h) of CD31-positive microvessels and in-vivo multiphoton microscopy images of perfused cortical capillaries with intravenously injected FITC-dextran (MW = 2000,000 Da) (j) in the peri-infarct cortex at 14 days in mice treated with control antibody or anti-Ly6G antibody, compared with sham-operated mice. Bar = 50 μm (e) and 100 µm (g). i, k Quantification of microvascular density (i) and perfused capillary length (k) for each group (n = 6). One-way ANOVA test was applied with *P = 0.0003 (Sham vs. Isotype (i)) *P = 0.0004 (Isotype vs. Anti-Ly6G (i)), *P = 0.0002 (Isotype vs. Anti-Ly6G (k)). Data are presented as mean ± SD. Source data underlying graph a–c, e, g, i, and k are provided as a Source Data file.

