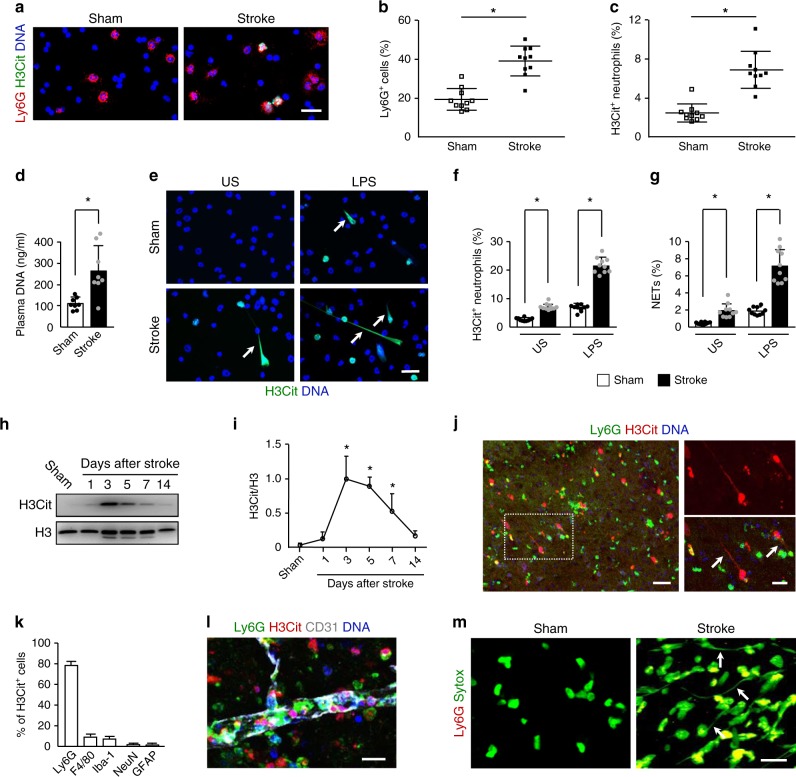
Fig. 3. Neutrophils form NETs presenting in the brain after stroke.
a Representative images of H3Cit (green) and Ly6G (red) double-positive cells in cytospins from sham-operated mice and ischemic mice at 3 days. DNA was visualized with Hoechst 33342 (blue). Bar = 30 μm. b, c Quantification of Ly6G-positive neutrophils in the total leukocyte population (b) and the percentage of H3Cit-positive neutrophils (c) in cytospins (n = 10 biologically independent experiments). Mann–Whitney test was applied with *P < 0.0001 (b), *P < 0.0001 (c). d Levels of plasma DNA were elevated at day 3 after stroke (n = 6 biologically independent experiments). Unpaired two-tailed Student’s t-test was applied with *P = 0.0026. e Representative immunofluorescence images of isolated peripheral blood neutrophils from sham-operated mice and ischemic mice at 3 days. Neutrophils were incubated in the presence or absence of LPS for 2.5 h and stained with Hoechst 33342 (blue) and H3Cit (green). Arrows indicate NETs. US, unstimulated. Bar = 30 μm. f, g Quantification of the percentage of H3Cit-positive neutrophils (f) and NETs (g) in isolated neutrophils (n = 10 biologically independent experiments). One-way ANOVA test was applied with *P < 0.0001 (Sham vs. Stoke in US (f)), *P < 0.0001 (Sham vs. Stoke in LPS group (f)), *P = 0.0235 (Sham vs. Stoke in US (g)), *P < 0.0001 (Sham vs. Stoke in LPS group (f)). US, unstimulated. h, i Representative immunoblots of the time course of NETs appearance (h) and quantification of the H3Cit levels (i) in the peri-infarct cortex of mice subjected to stroke or sham operation (n = 5). One-way ANOVA test was applied with *P < 0.0001 (Sham vs. 3d), *P < 0.0001 (Sham vs. 5d), *P = 0.0039 (Sham vs. 7d). j Representative confocal images showing NET formation in the peri-infarct cortex of mice at 3 days after stroke. Inset is magnified on the right side. Arrows indicate NETs. Bar = 40 μm (left) and 20 μm (right). Arrows indicate extracellular DNA fibers. k Graphs compare the number of H3Cit+Ly6G+ neutrophils, H3Cit+F4/80+ macrophages/microglial cells, H3Cit+Iba1+ microglial cells, H3Cit+NeuN+ neurons, and H3Cit+ GFAP+ astrocytes in mice at 3 days after stroke (n = 5 biologically independent experiments). l Representative confocal image showing the formation of intravascular and intraparenchymal NETs at 3 days after stroke. Bar = 15 μm. Independent experiments are repeated at least three times. m Representative in-vivo multiphoton microscopy images of extracellular DNA (green) and neutrophils in the peri-infarct cortex of mice at 3 days. Extracellular DNA (green) were labeled with intravenous injection of Sytox green and neutrophils (red) with intravenous injection of PE-conjugated monoclonal Ly6G antibody. Arrows indicate extracellular DNA fibers. Bar = 20 µm. Independent experiments are repeated at least three times. Data are presented as mean ± SD. Source data underlying graph b–d, f–i, and k are provided as a Source Data file.

