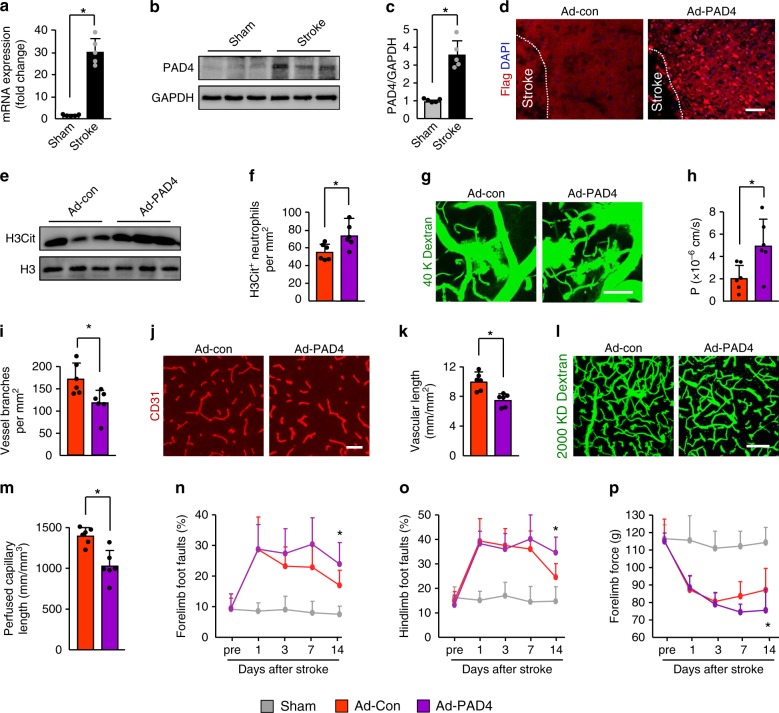
Fig. 6. Overexpression of PAD4 exacerbates BBB breakdown and reduced revascularization.
a PAD4 mRNA expression was measured by quantitative real-time PCR in the peri-infarct cortex at 3 days, compared with sham-operated mice (n = 5); Mann–Whitney test was applied with *P = 0.0079. b, c Representative immunoblots (b) and quantification of PAD4 levels (c) in the peri-infarct cortex at 4 days after injection of control (Ad-Con) or PAD4 adenovirus (Ad-PAD4) (n = 5); Mann–Whitney test was applied with *P = 0.0079). d Representative images of recombinant Adeno-PAD4-flag-infected cells in the ischemic cortex. Mice were treated with recombinant Adeno-PAD4-flag (right panel) or empty adenovirus (left panel). At 4 days after injection, brain sections were stained with an antibody against Flag. Bar = 40 μm. e Representative immunoblots of H3Cit levels in the peri-infarct cortex at 3 days. f Quantification of the numbers of H3Cit-positive neutrophils in the peri-infarct cortex at 4 days after injection of control or PAD4 adenovirus (n = 6); unpaired two-tailed Student’s t-test was applied with *P = 0.0230. g In-vivo multiphoton microscopic images of intravenously injected FITC-dextran (MW = 40,000 Da; green) leakage in cortical vessels at 14 days. Bar = 100 μm. h Quantification of the permeability (P) product of FITC-dextran for each group (n = 6); unpaired two-tailed Student’s t-test was applied with *P = 0.0244. i Quantification of vascular branches in mice treated with control or PAD4 adenovirus at 14 days after stroke (n = 6), unpaired two-tailed Student’s t-test was applied with *P = 0.0170. j, k Confocal images of CD31-positive microvessels (j) and quantification of microvascular density (k) in the peri-infarct cortex at 14 days (n = 6), unpaired two-tailed Student’s t-test was applied with *P = 0.0019. Bar = 50 μm. l, m In-vivo multiphoton microscopic images of perfused cortical capillaries with intravenously injected FITC-dextran (l) and quantification of perfused capillary length (m) at 14 days after stroke (n = 6), unpaired two-tailed Student’s t-test was applied with *P = 0.0017. Bar = 100 μm. n–p Overexpression of PAD4 worsened neurological outcomes in beam walking test (n, o) and forelimb force test (p) (n = 10). One-way ANOVA test was applied with *P = 0.001 (n), *P = 0.0015 (o), *P < 0.0001 (p) (Sham and Ad-Con). *P = 0.0015 (n), *P = 0.0015 (o), *P = 0.0279 (p) (Ad-Con and. Ad-PAD4). Data are presented as mean ± SD. Source data underlying graph a–c, e, f, h, i, k, m–p are provided as a Source Data file.

