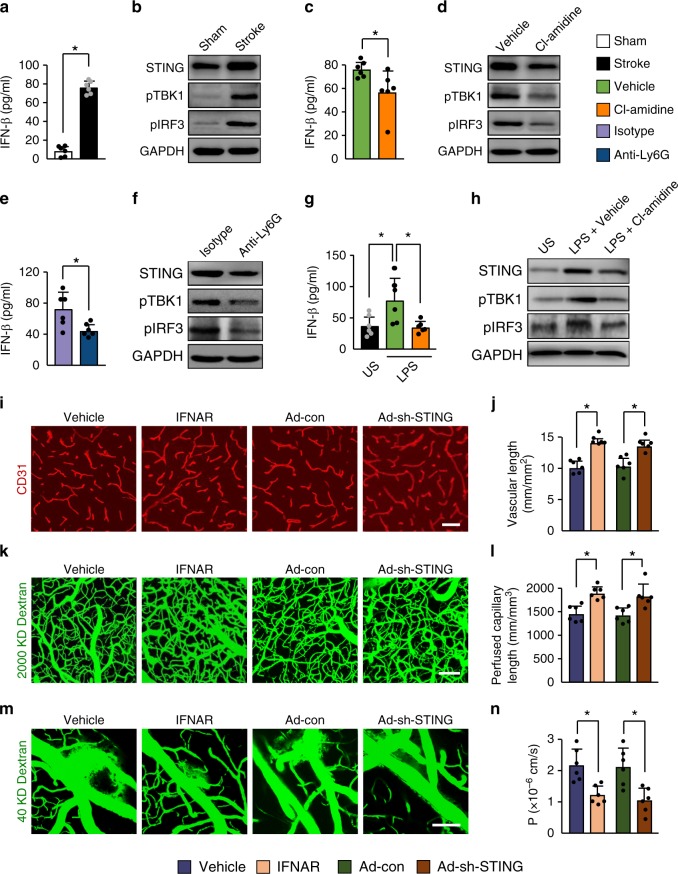
Fig. 8. STING-mediated effects on vascular remodeling are due to NETs.
a Levels of IFN-β were increased in the ischemic cortex at 3 days, compared with sham-operated brains (n = 6), unpaired two-tailed Student’s t-test was applied with *P < 0.0001. b Immunoblot analysis of STING, phosphorylated TBK1 (pTBK1), and pIRF3 in the cortex of mice without stroke or at day 3 after stroke. c Levels of IFN-β in the ischemic cortex at 3 days in mice treated with control or the PAD inhibitor Cl-amidine (n = 6). Mann–Whitney test was applied with *P = 0.0152. d Immunoblot analysis of STING, pTBK1, and pIRF3 in the ischemic cortex at day 3. e Levels of IFN-β in the ischemic cortex at 3 days in mice treated with control antibody or anti-Ly6G antibody (n = 6), unpaired two-tailed Student’s t-test was applied with *P = 0.0148. f Immunoblot analysis of STING, pTBK1, and pIRF3 in the ischemic cortex at day 3. g Levels of IFN-β in isolated bone marrow neutrophils from ischemic mice. Neutrophils were stimulated with LPS in the presence or absence of the PAD inhibitor Cl-amidine (n = 6). One-way ANOVA test was applied with *P = 0.0230 (Stoke vs. Vehicle), *P = 0.0160 (Vehicle vs. Cl-amidine). US, unstimulated. h Immunoblot analysis of STING, pTBK1, and pIRF3 in isolated neutrophils for each group (n = 5). i, j Confocal images of CD31-positive microvessels (i) and quantification of microvascular density (j) in the peri-infarct cortex at 14 days in mice treated with control IgG or IFNAR-neutralizing antibody, and STING shRNA or control adenovirus (n = 6), unpaired two-tailed Student’s t-test was applied with *P < 0.0001 (Vehicle vs. IFNAR), *P = 0.0007 (Ad-con vs. Ad-sh-STING). Bar = 40 μm. k, l In-vivo multiphoton microscopic images of perfused cortical capillaries with intravenously injected FITC-dextran (k) and quantification of perfused capillary length (l) at 14 days after stroke (n = 6), unpaired two-tailed Student’s t-test was applied with *P = 0.0006 (Vehicle vs. IFNAR), *P = 0.0080 (Ad-con vs. Ad-sh-STING). Bar = 100 μm. m, n In-vivo multiphoton microscopic images (m) of intravenously injected FITC-dextran leakage in cortical vessels at 14 days and quantification of the permeability (P) product of FITC-dextran (n) for each group (n = 6), unpaired two-tailed Student’s t-test was applied with *P = 0.0028 (Vehicle vs. IFNAR), *P = 0.0053 (Ad-con vs. Ad-sh-STING). Bar = 100 μm. Data are presented as mean ± SD. Source data underlying graph a–h, j, l, and n are provided as a Source Data file.

