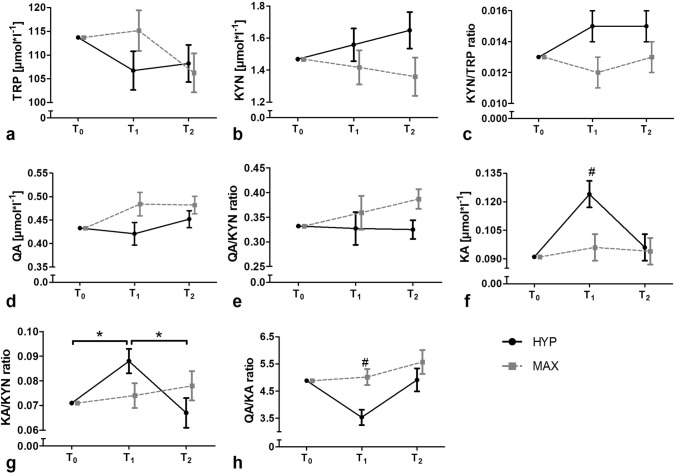
Fig. 2.
Baseline-adjusted kinetics of tryptophan and its metabolites assessed in blood serum in response to acute hypertrophic and maximal strength exercise, respectively. *Significant time effect (p ≤ 0.05); #significant interaction effect (p ≤ 0.05); HYP hypertrophic strength loading; MAX maximal strength loading; T0 baseline, T1 immediately after strength loading completion; T2 1 h after strength loading completion. a tryptophan concentrations; b kynurenine concentrations; c kynurenine–tryptophan ratio; d quinolinic acid concentrations; e quinolinic acid–kynurenine ratio; f kynurenic acid concentrations; g kynurenic acid–kynurenine ratio; h quinolinic acid–kynurenic acid ratio. Data presented as baseline-adjusted means ± standard error

