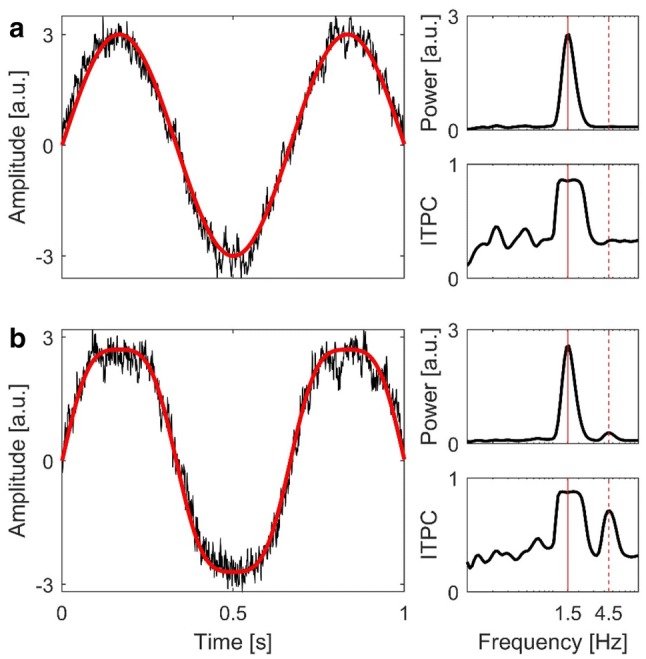
Fig. 10.

Upper panel a: excerpt of a simulated sinewave at 1.5 Hz (red curve) and added pink-noise (black curve). Lower panel b: excerpt of a simulated sinewave consisting of oscillatory components at 1.5 Hz and 4.5 Hz with an amplitude ratio of 10:1 (red curve), including added pink-noise (black curve). Panels to the right show time-averaged wavelet power and ITPC spectra of the whole simulated sinewaves (including noise), respectively. Red solid lines represent the main frequency component at 1.5 Hz. Red dashed lines represent the superimposed oscillatory component at 4.5 Hz
