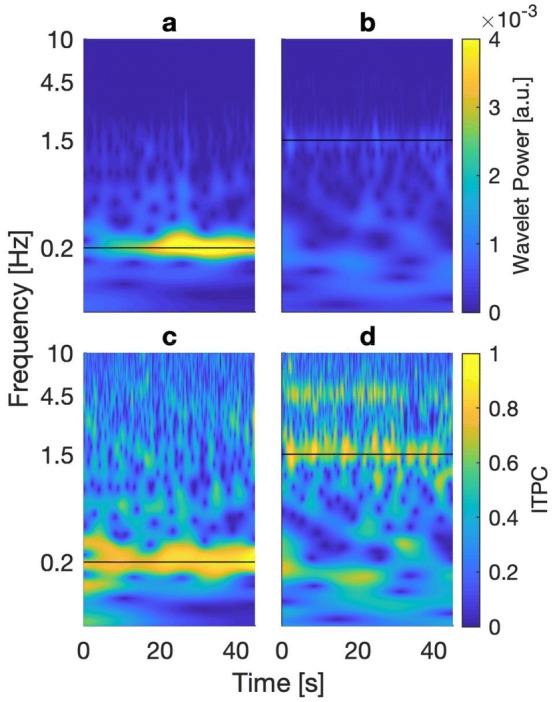
Fig. 2.

Time–frequency resolved spectra of COP signals obtained from subject EO, averaged over 20 trials. Black horizontal bars represent frequency of visual stimulation. a Wavelet power spectrum for visual stimulation at 0.2 Hz. b Wavelet power spectrum from visual stimulation at 1.5 Hz. c ITPC spectrum from stimulation at 0.2 Hz. d ITPC spectrum from stimulation at 1.5 Hz. In contrast to the wavelet power spectrum, ITPC revealed strong coherence for stimulation at both 0.2 and 1.5 Hz, with an additional frequency band of high phase coherence at about triple the frequency of visual stimulation for the 1.5 Hz condition
