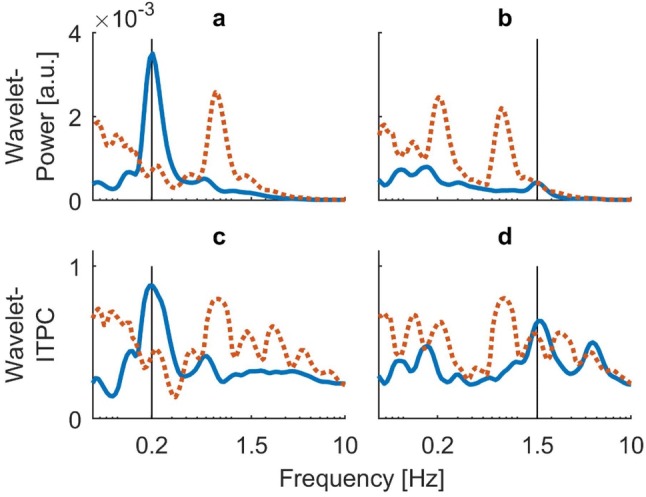
Fig.3.

Time-averaged (global) spectra of COP-signals obtained from subject EO. Blue lines indicate mean response over 20 trials. Orange dotted lines represent the calculated upper 95% confidence interval of the bootstrapped background. Black vertical bars represent frequency of visual stimulation. a Global wavelet power spectrum for visual stimulation at 0.2 Hz. b Global wavelet power spectrum from visual stimulation at 1.5 Hz. c Global ITPC spectrum from stimulation at 0.2 Hz. d Global ITPC spectrum from stimulation at 1.5 Hz. All spectra show significant responses at the respective stimulus frequency, with ITPC revealing a second significant peak at around 4.5 Hz for stimulation at the high frequency. The remaining frequencies that went into the null distribution for this subject were 0.7 Hz, 1.3 Hz and 1.6 Hz
