
Fig. 5.
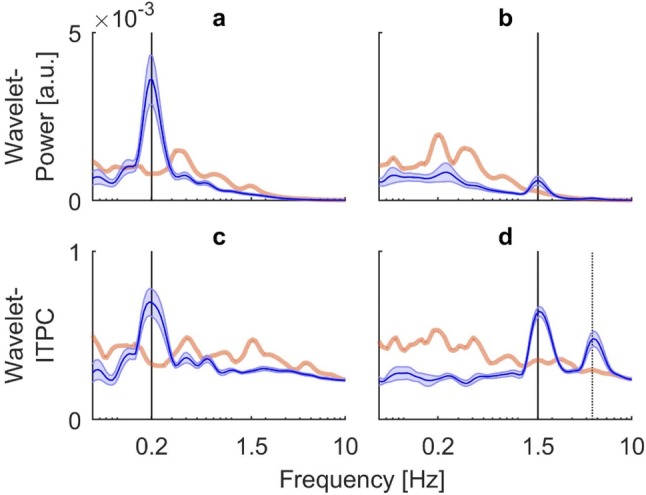
Group results for time-averaged (global) wavelet power and ITPC spectra of the obtained COP signals. Blue lines indicate mean across subjects with shaded areas representing standard error. Orange transparent lines show mean upper 95% confidence boundary of the bootstrapped background. Black vertical bars indicate frequency of visual stimulation. a Global wavelet power for visual stimulation at 0.2 Hz. b Global wavelet power of stimulation at 1.5 Hz. c Global ITPC for stimulation at 0.2 Hz. d Global ITPC for stimulation at 1.5 Hz. All spectra show a significant response at the respective stimulus frequency. For stimulation at 1.5 Hz, ITPC reveals an additional significant phase coupling at around triple the frequency, the black dotted line indicates the frequency value of 4.5 Hz