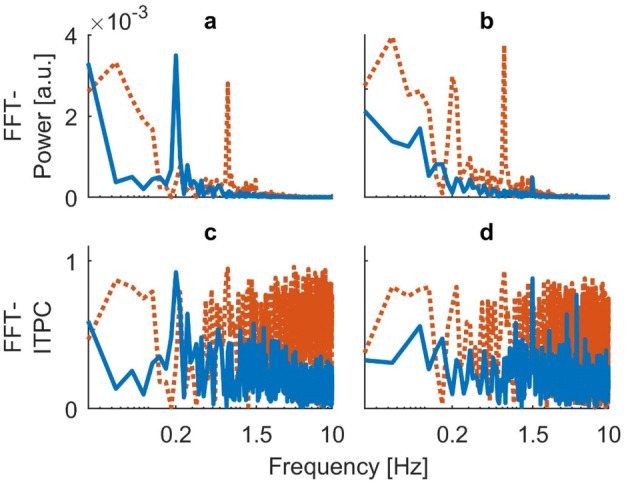
Fig. 8.

FFT-based spectra obtained from subject EO. Blue lines indicate mean response over 20 trials. Orange dotted lines represent the calculated upper 95% confidence interval of the bootstrapped background. a FFT power spectrum for visual stimulation at 0.2 Hz. b FFT power spectrum from visual stimulation at 1.5 Hz. c FFT-based ITPC spectrum from stimulation at 0.2 Hz. d FFT-based ITPC spectrum from stimulation at 1.5 Hz. The spectra reveal the artifacts resulting from FFT decomposition, particularly in the bootstrapped background of ITPC. These include a drift in low frequencies and substantial noise in higher frequencies (c, d)
