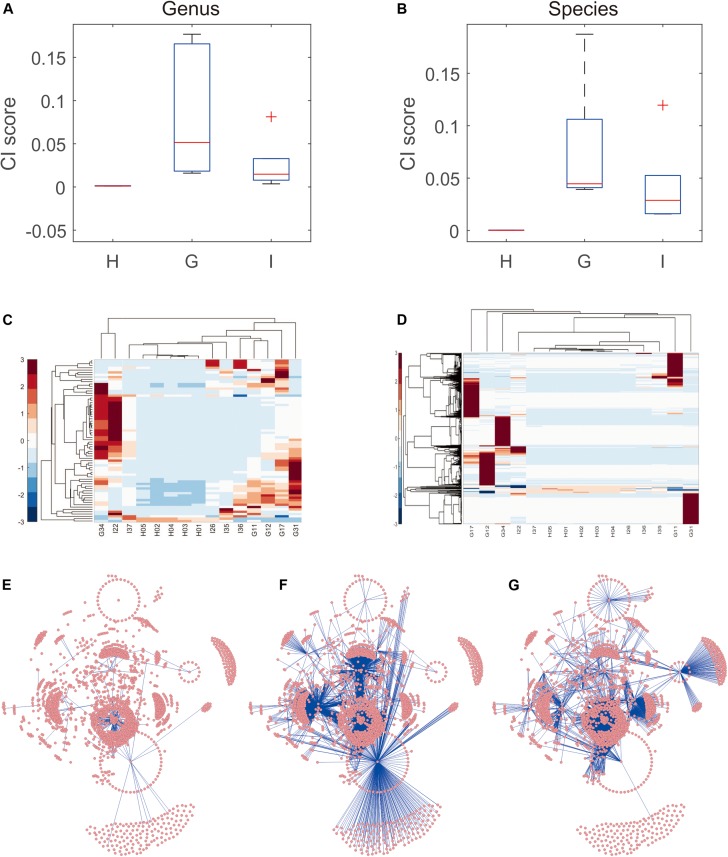
FIGURE 3.
Microbiota community distinguishing small-bowel inflammation and chronic gastritis. (A) The distribution of CI scores distinguishes different groups on genus level. (B) The distribution of CI scores distinguishes different groups on species level. (C) The abundance heatmap of microbes in iENA markers. (D) The sPCC heatmap of microbe-pairs involved in iENA markers. (E) The microbe association network characterizing healthy state. (F) The microbe association network characterizing chronic gastritis state. (G) The microbe association network characterizing small bowel-inflammation state.

