
Figure 5.
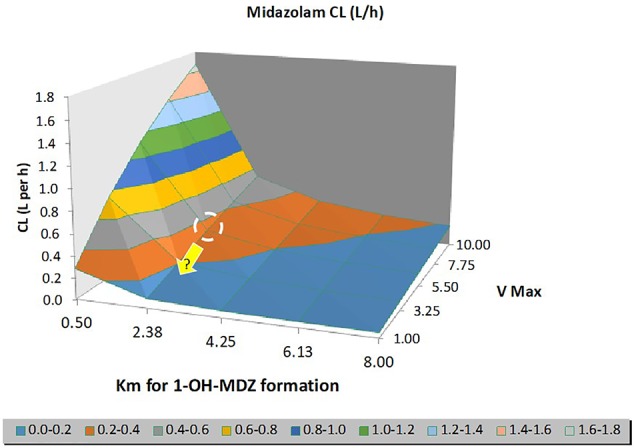
Output of a sensitivity analysis for midazolam clearance (CL) in neonates, illustrating the model-predicted impact of changes in Michaelis–Menten constant (Km) and/or maximum reaction rate (Vmax) describing the intrinsic formation CL of 1-OH midazolam by CYP3A4. The ‘dashed' circle represents the Vmax/Km values at normothermia, while the yellow arrow indicates a plausible change in Vmax (rather than Km) under conditions of hypothermia.