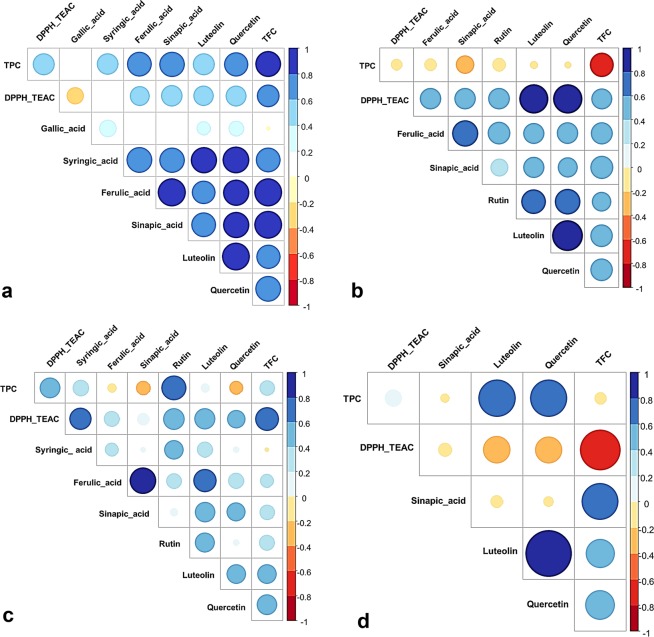
Figure 7.
Pearson’s correlation between active compounds and their antioxidant capacity in different plant organ extracts: (a) correlation in roots, (b) correlation in stems, (c) correlation in leaves, and (d) correlation in seeds. TPC: Total Phenolic Contents, TFC: Total Flavonoids Contents, DPPH_TEAC: antioxidant capacity. The intensity of the colour and the size of the circle are proportional to the correlation coefficients. To the right of the correlogram, the colour legend shows the correlation coefficients and the corresponding colours. The correlation was visualised by the ggcorrplot package.

