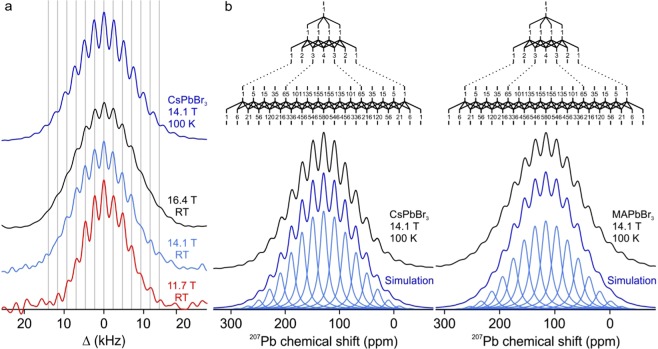
Figure 2.
(a) 207Pb NMR spectra of CsPbBr3 acquired at 14.1 T at 100 K (dark blue), 16.4 T at RT (black), 14.1 T at RT (light blue) at 11.7 T and RT (red). The grey lines serve as a guide to the eye by marking the lines of the coupling pattern. The spectra are displayed against a frequency axis centered around 0 Hz. This illustrates most clearly the constant splitting distance (in Hz) between lines, due to a scalar coupling of 1JPb-Br = 2.3 kHz at RT. (b) Coupling trees for six equivalent spins I = 3/2 (top) and the 207Pb NMR spectra of CsPbBr3 (left) and MAPbBr3 (right) acquired at 100 K on a 14.1 T instrument. The acquired spectra are shown in black. The simulated individual lines with intensities obtained from the coupling trees and scalar couplings of 2.5 and 2.4 kHz for CsPbBr3 and MAPbBr3 respectively are displayed in light blue. The sum of the lines is shown in dark blue and is matching the experimental data.

