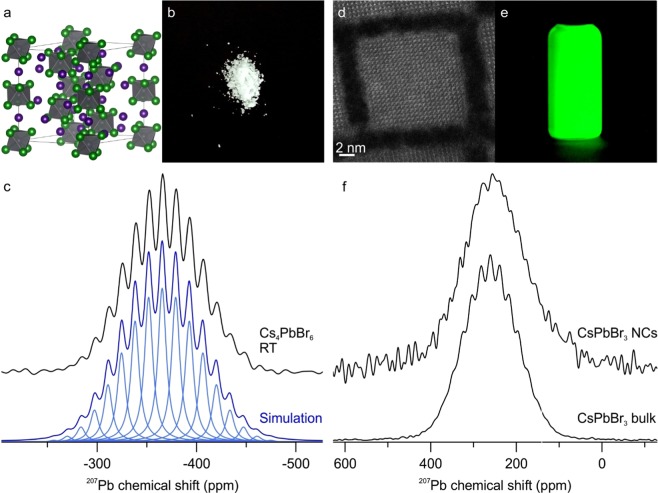
Figure 4.
(a) Crystal structure of 0D Cs4PbBr6 with isolated PbBr6-octahedra. (b) Picture of Cs4PbBr6 powder. (c) 207Pb NMR spectrum of Cs4PbBr6 (black) at RT acquired on a 16.4 T spectrometer. The simulated individual lines with intensities obtained from the coupling tree, a FWHM of 1.5 kHz and a scalar coupling of 2.0 kHz are displayed in light blue. The sum of the lines is shown in dark blue and is matching the experimental data. (d) High-Angle Annular Dark-Field Scanning Transmission Electron Microscopy (HAADF-STEM) image of a single CsPbBr3 NC. (e) Colloidal solution of CsPbBr3 NCs under UV excitation. (f) 207Pb NMR spectra of CsPbBr3 bulk (bottom) and NCs (top) acquired at RT on a 11.7 T instrument with identical measurement and processing parameters. The coupling pattern cannot be resolved for the NCs and the total line width increases to 17.6 kHz. This was attributed to higher PbBr6-octahedral disorders over the whole nanocrystal compared to the bulk material.

