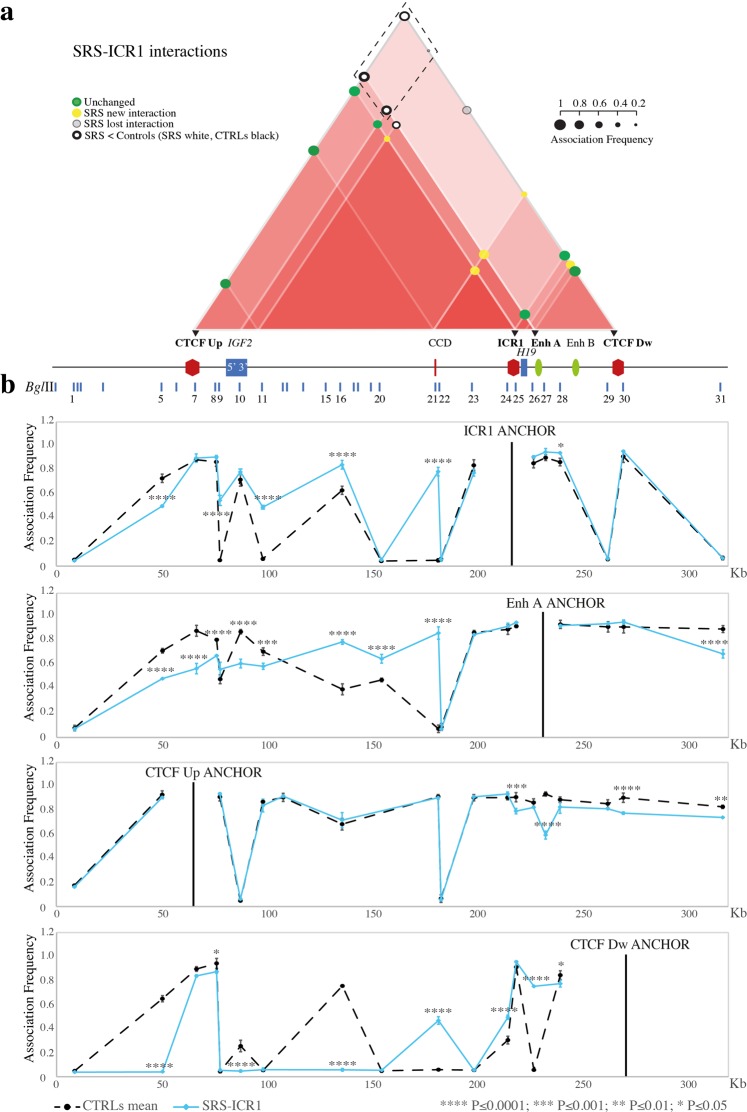
Figure 5.
Chromatin architecture alterations at the ICR1 locus in SRS-ICR1 cells. The entire figure is to scale and has a reverse orientation with respect to Fig. 1 because these loci are classically reported with a reverse orientation since the genes are transcribed on the negative strand. (a) Schematic showing modifications of the chromatin interactome in the ICR1 domain in the SRS-ICR1 cell line compared with the mean of controls. All the differences displayed were statistically significant. Red triangles, interactions between the different elements in the region. The intensity of the red colour is directly proportional to the number of interactions present in a sub-region. Coloured circles represent association frequencies: green, unchanged interaction compared with the control mean; yellow, novel interaction in the pathological cell line; light grey, interaction lost in the pathological cell line; black circle >white circle, decrease of the interaction strength in the pathological cell line compared with the control mean. A linear representation of the ICR1 imprinted domain is depicted below. Black triangles and bold characters indicate the anchors, used for 3C analysis. The dotted rectangle highlights the decreased or lost ROIs that indicate a loss of contact between enhancers (Enh A and Enh B) and IGF2 promoter in the SRS-ICR1 cells. (b) ICR1 locus looping profile for the different anchors in the controls (dotted black) and SRS-ICR1 (light blue) cell lines. BglII restriction sites are indicated above. Each point in the profile represents the mean ± standard deviation of two independent 3C experiments and indicates the association frequency between the anchor and the fragment to the left of the corresponding BglII restriction site. Statistically significant differences (two-way ANOVA test) between the mean of controls and SRS are indicated by asterisks; ****P ≤ 0.0001; ***P ≤ 0.001; **P ≤ 0.01; *P ≤ 0.05. Overall, the results represent the sum of the chromatin conformations of normal alleles (paternal and maternal) and the SRS pathological allele.

