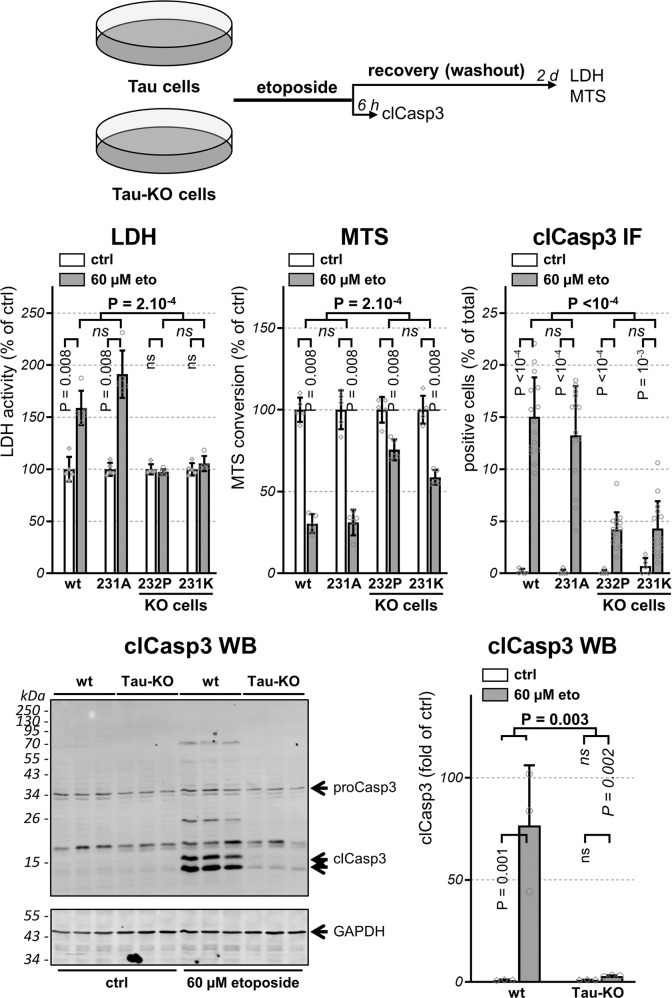
Fig. 2. Tau deficiency confers resistance to etoposide-induced apoptosis.
Scheme representing the design of the experiment with parental and 231A (Tau) cells compared to 232P and 231K (Tau-KO) cells treated 30 min with 60 μM etoposide and recovered as indicated before analysis. LDH and MTS values are shown as percentage of parental cells (wt), mean ± SD of five biological replicates. To measure activation of apoptosis, percent positive cells for cleaved-caspase-3 (clCasp3) is determined on confocal microscope images and normalized for total DAPI-positive cells, mean ± SD of five images for the untreated cells (ctrl) and of 15 images for etoposide-treated cells (60 μM eto), n > 500 cells/condition, representative experiment of n > 3 biological replicates. Activated clCasp3 was also analyzed by western blot with GAPDH as loading control and 15 and 17 kDa clCasp3 quantified by normalization with GAPDH, mean ± SD (n = 3 biological triplicates). Statistical analysis by independent measures ordinary two-way ANOVA, source of variation for cell lines (in bold), multiple Bonferroni pairwise comparisons for treatment between lines (in italics) or for each line (in vertical).

