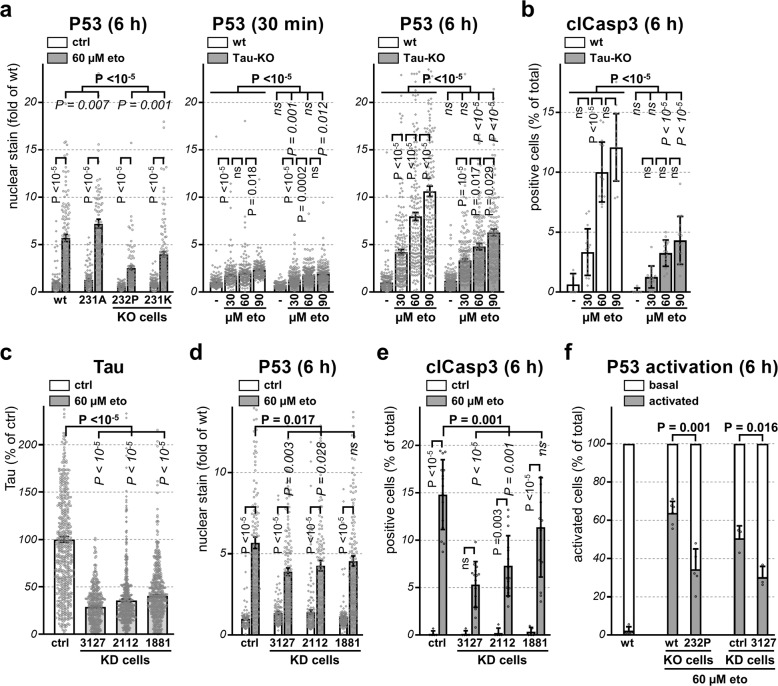
Fig. 5. Tau depletion decreases P53 level and apoptosis.
For all panels the indicated cell lines (Tau-KO are 232P cells) were treated 30 min with the indicated etoposide concentrations and recovery times. a Mean intensity ± sem of single-cell nuclear P53 staining (DAPI mask, ImageJ) is shown as fold of wt cells at basal conditions, n > 100 cells/condition distributed over five images. b Percent clCasp3-positive cells are shown as mean ± SD of five images for the untreated cells and of 15 images for etoposide-treated cells, n > 500 cells/condition. c Mean intensity ± sem of single-cell Tau staining (tubulin mask, ImageJ) for the indicated cell lines is shown as percent of mock shRNA cells (ctrl), n > 160 cells/condition distributed over five images. d Mean intensity of single-cell nuclear P53 staining quantified as in a, n > 380 cell/condition distributed over 15 images from n = 3 biological replicates. e Percent clCasp3-positive cells quantified as in b, n > 500 cell/condition. f An arbitrary threshold was applied in order to count P53-positive cells as percentage ± SD of total DAPI-positive cell number, n > 100 cells/conditions. For the comparison between the four cell lines (a), non-parametric independent Mann–Whitney U test for genotype (in bold) and Kruskal–Wallis pairwise comparison of treatment for cell lines with same genotype (in italics) or for each line (in vertical). For the dose-dependency (a, b), non-parametric independent Mann–Whitney U test between cell lines (in bold), Kruskal–Wallis pairwise comparison for each dose (in italics) and between doses (in vertical). Non-parametric independent Mann–Whitney U test (c–e) between control and the three Tau-KD lines (in bold) and Kruskal–Wallis pairwise comparison for each Tau-KD line (in italic) and for each treatment (in vertical). Unpaired two-tailed t test with Welch’s correction (f).

