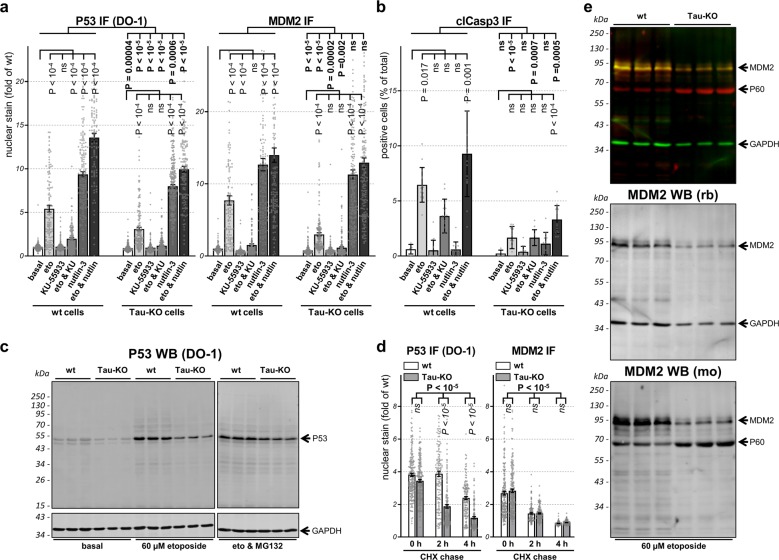
Fig. 7. Role of P53 and MDM2 modifications for P53 function and stability.
a, b Parental (wt) or 232P (Tau-KO) cells treated 30 min without (basal) or with 60 μM etoposide and recovered for 6 h in the absence (eto) or presence of 10 µg/mL KU-55933 and/or 5 µg/mL nutlin-3. a Mean intensity ± sem of single-cell nuclear P53 or MDM2 (DAPI mask, ImageJ) shown as fold of basal conditions, n > 100 cells/condition distributed over five images. b Percent clCasp3-positive cells shown as mean ± SD of five images (basal) or 15 images (treatments), n > 500 cells/condition. Non-parametric independent samples test and Kruskal–Wallis pairwise comparison between cell lines (in bold) or for treatment for each cell line (in vertical). c Western bot analysis of P53 in parental (wt) or 232 P (Tau-KO) cells at basal conditions, after 30 min 60 μM etoposide and 4 h recovery without or with 10 μM MG132. GAPDH served as loading control. d Parental (wt) or 232P (Tau-KO) cells pre-treated for 30 min with 60 μM etoposide followed by 4 h with 10 μM MG132, were incubated with 25 μM of cycloheximide (CHX) for the indicated chase times. Single-cell nuclear P53 or nuclear MDM2 (DAPI mask, ImageJ) shown as fold of wt cells at basal conditions. Mean intensity ± sem of n > 100 cells/condition distributed over five images. Independent measures ordinary two-way ANOVA, source of variation for cell lines (bold), multiple Bonferroni pairwise comparisons of treatment for each line (in italic). e Parental (wt) or (Tau-KO) 232P cells treated for 30 min with 60 μM etoposide and 6 h recovery analyzed with a 90 kDa MDM2 rabbit antibody (green and middle panel with GAPDH as loading control) or a 60 and 90 kDa MDM2 mouse antibody (red and bottom panel).

