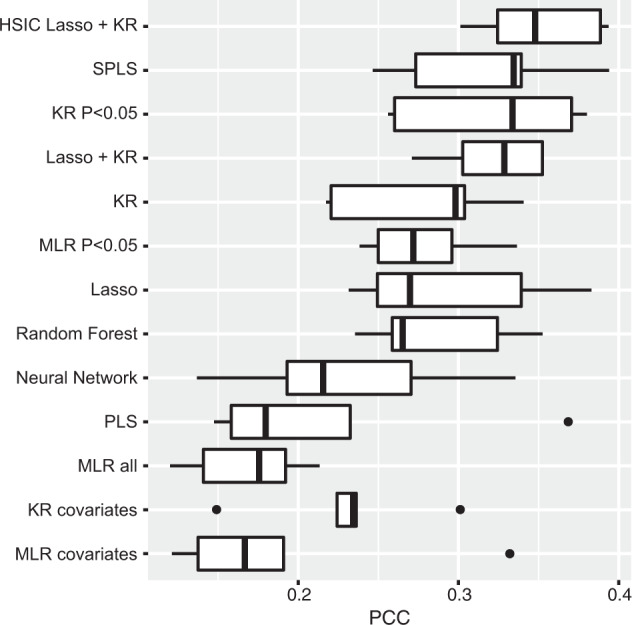
Fig. 1. Predictive power for quantitative CES-D scores.

Boxplots show the predictive powers in the fivefold cross-validations of each prediction model utilizing CES-D scores as response variables and metabolites and other covariates as predictive variables. Abbreviations: CES-D Center for Epidemiologic Studies-Depression Scale, HSIC Hilbert–Schmidt independence criterion, Lasso least absolute shrinkage and selection operator, KR kernel regression, SPLS sparse partial least squares, KR P < 0.05 kernel regression with P < 0.05 variables, Lasso + KR kernel regression with variables selected by Lasso, MLR P < 0.05 multiple linear regression with P < 0.05 variables, PLS partial least squares, MLR all multiple linear regression with all variables, KR covariates kernel regression with only covariates, MLR covariates multiple linear regression with only covariates, PCC predictive correlation coefficient.
