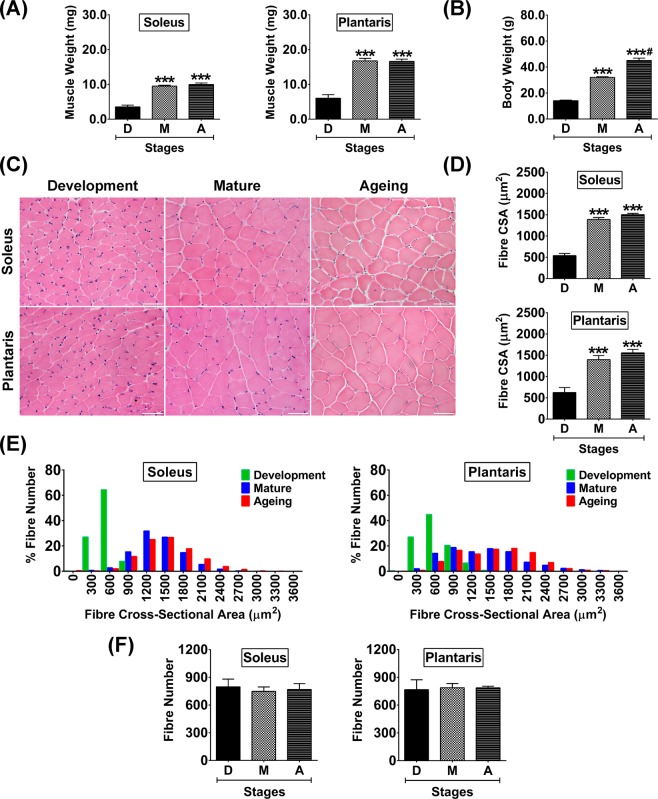
Figure 2.
Muscle weight, body weight, and histological characteristics of soleus and plantaris muscles during development, maturation, and ageing. (A) Muscle weight, (B) Body weight, (C) Representative hematoxylin and eosin-stained images of developmental, mature, and aged muscles, (D) Quantitative analysis of fibre cross-sectional area (CSA), (E) Histogram analysis of muscle fibre size distribution, and (F) Quantitative analysis of fibre number. Images were taken at ×400 magnification, scale bars = 50 µm. ***p < 0.001 compared to developmental stage, #p < 0.001 compared to maturation stage (n = 6 mice/group).

