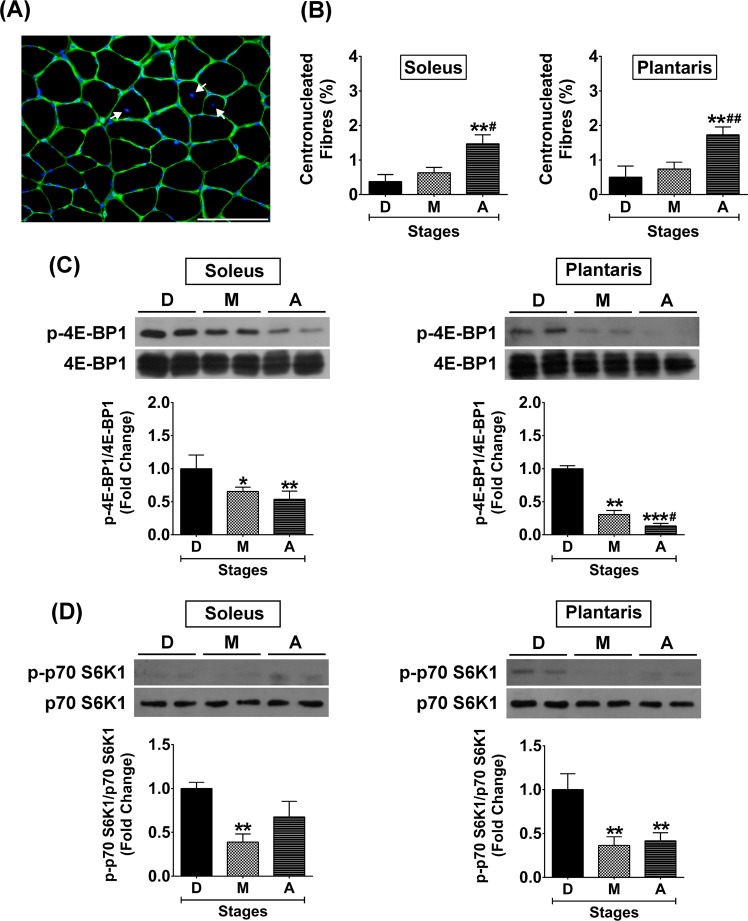
Figure 7.
Centronucleated muscle fibres and downstream mTOR signalling protein expression in soleus and plantaris muscles during development, maturation, and ageing. (A) Representative image of centronucleated muscle fibres, (B) Percentage of centronucleated muscle fibres at different stages of growth, (C) Phosphorylation of 4E-BP1/4E-BP1 protein expression level, and (D) Phosphorylation of p70 S6K1/p70 S6K1 protein expression level. Image was taken at ×400 magnification, scale bar = 50 µm. *p < 0.05, **p < 0.01, ***p < 0.001 compared to developmental stage and #p < 0.05, ##p < 0.01 compared to maturation stage (n = 6 mice/group).

