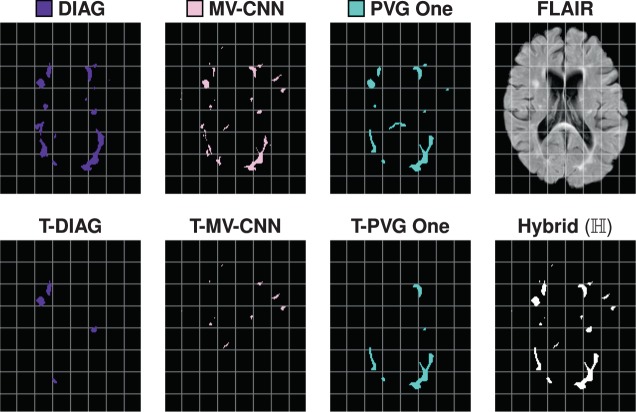
Figure 12.
For a test data set, in the top row, we show the axial slices of the DIAG, MV-CNN, and PVG One segmentations, and the corresponding FLAIR image. In the second row, we show the volume thresholded version of DIAG (T-DIAG), MV-CNN (T-MV-CNN), and PVG One (T-PVG One), after the corresponding thresholds have been applied from the 2-Fold variety of our hybrid algorithm. The final image in the second row is the segmentation generated from the union of these results and is denoted Hybrid (). For this subject, the IMI algorithm did not contribute any lesions and the corresponding images are not displayed.

