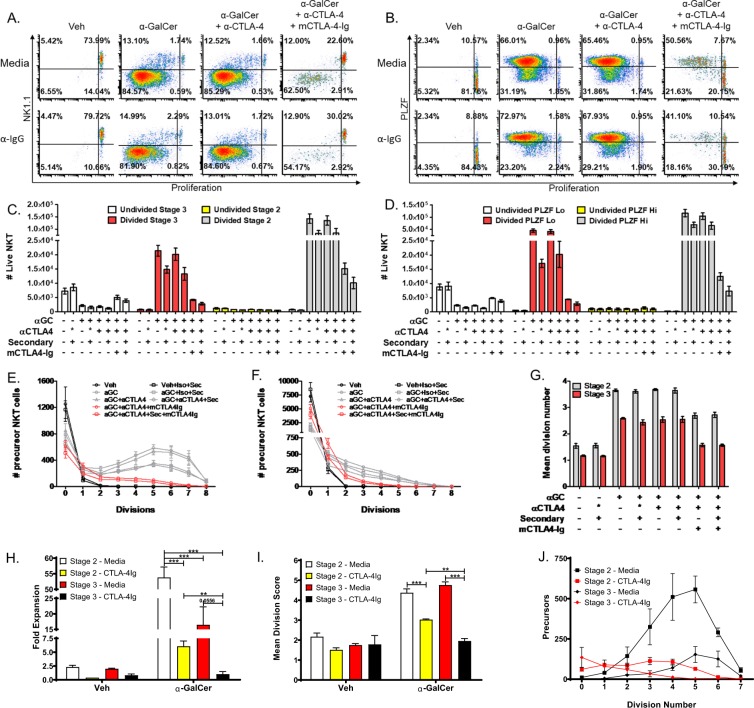
Figure 3.
NKT cell subtypes are differentially affected by CD80/86 blockade. (A) Representative plots of NKT cell populations stratified by NK1.1 expression and proliferation dye dilution. Quadrants represent the following populations: UR, Undivided Stage 3, UL, Divided Stage 3, LR, Undivided Stage 2, LL, Divided Stage 2. (B) Representative plots of NKT cell populations stratified by PLZF expression and proliferation dye dilution. Quadrants represent the following populations: UR, Undivided PLZF-Hi, UL, Divided PLZF-Hi, LR, Undivided PLZF-Lo, LL, Divided PLZF-Lo. (C) The number of NKT cells present in the following bins: Undivided Stage 3 (white bars), Divided Stage 3 (red bars), Undivided Stage 2 (yellow bars), Divided Stage 2 (grey bars). (D) The number of NKT cells present in the following bins: Undivided PLZF-Hi (white bars), Divided PLZF-Hi (red bars), Undivided PLZF-Lo (yellow bars), Divided PLZF-Lo (grey bars). (E) The precursor proliferation curve of stage 2 NKT cells. (F) The precursor proliferation curve of stage 3 NKT cells. (G) The mean division number of stage 2 and stage 3 precursor cells. (H) Fold expansion of FACS-isolated stage 2 and stage 3 NKT cells after co-culture with splenocytes loaded with 10 ng/mL α-GalCer. (I) Mean division score of sorted stage 2 and stage 3 NKT cells after co-culture with splenocytes loaded with 10 ng/mL α-GalCer. (J) Precursor proliferation curve of sorted NKT cells after co-culture with splenocytes loaded with 10 ng/mL α-GalCer. All data displayed in graphs correspond to mean +/− SEM of 3 biological replicates. Statistical significance was determined using one-way ANOVA followed by Bonferroni tests. Relevant statistical analyses are discussed in the text. Flow cytometry gating strategy outlined in Materials and Methods.

