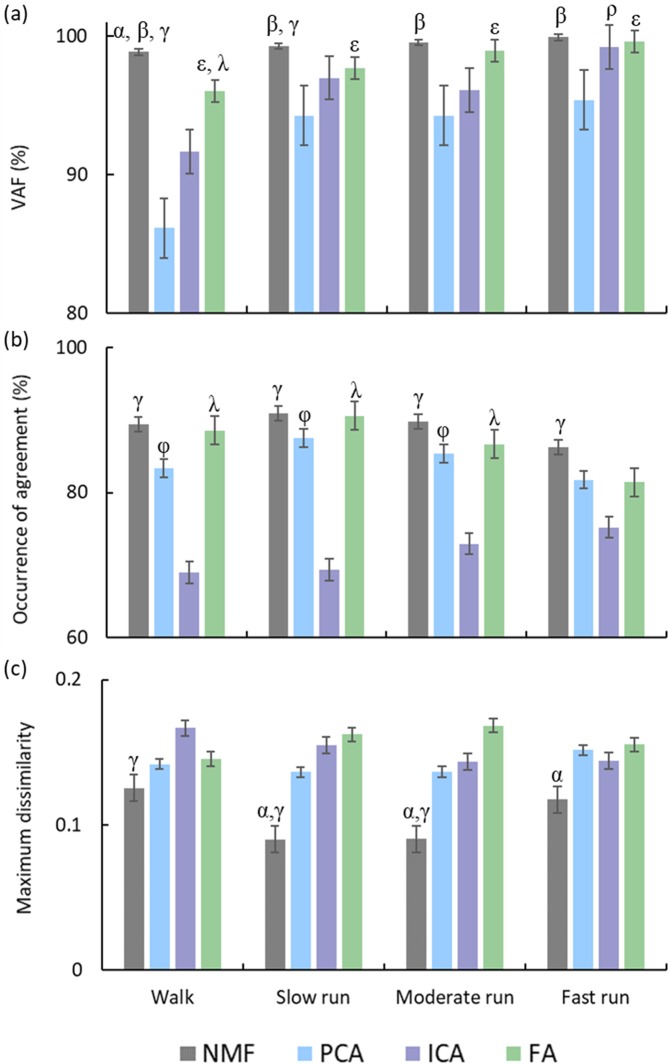
Figure 4.
(a) VAF (%), (b) occurrence of agreement (%), and (c) maximum dissimilarity between the emperical cumulative distribution function (ECDF) of the muscle activation patterns and synergy excitation primitives at four gait speeds. Error bars indicate standard deviation. The following symbols represent significant differences (p < 0.05) between factorisation methods, α: NMF > FA or NMF < FA, β: NMF > PCA, γ: NMF > ICA or NMF < ICA, ε: FA > PCA, λ: FA > ICA, ρ: ICA > PCA, φ: PCA > ICA.

