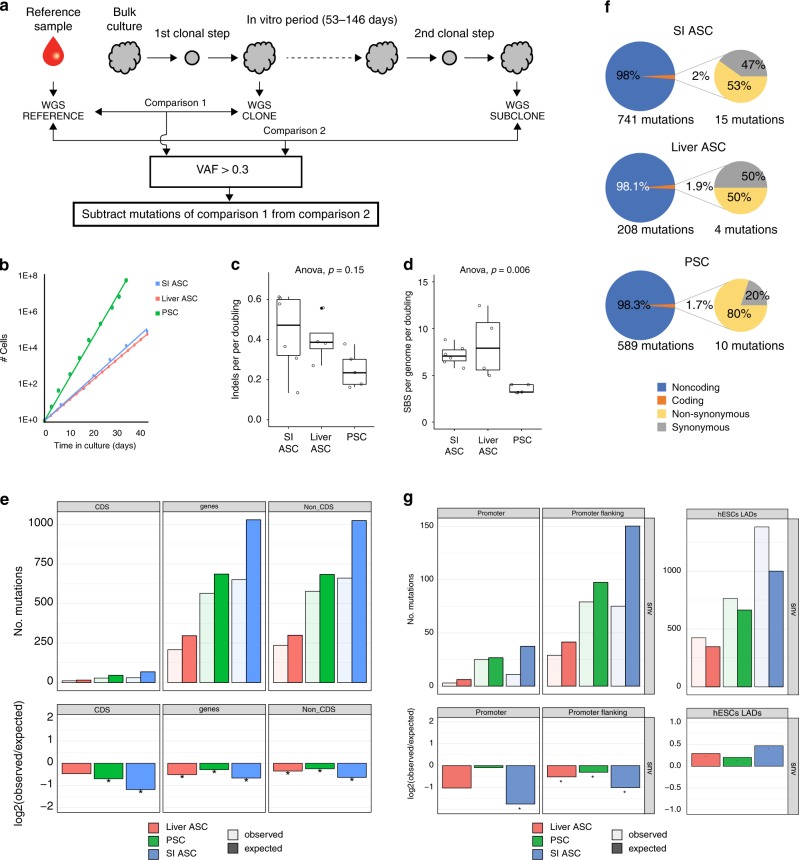
Fig. 1. In vitro mutation accumulation in PSCs (n = 5), liver stem cells (n = 4), and intestinal stem cells (n = 6).
a Schematic overview of the experimental setup to determine in vitro-accumulated mutations in individual human PSCs, liver stem cells, and intestinal stem cells. Clonal stem cell lines were cultured for ~2–5 months during which mutations were allowed to accumulate. At the end of the culture period, a second clonal step was performed, and the derivative subclones were expanded until enough DNA could be isolated for WGS analysis. A biopsy or bulk culture was used as a reference sample to determine and exclude all germline variants, which were subtracted from the clone (comparison 1) and from the subclone (comparison 2). Finally, with these results, the clonal variants were subtracted to identify all variants that were unique to the subclone. b Growth curves for PSCs (green), liver stem cells (red), and intestinal stem cells (blue). c Box–whisker plots showing the median, first and third quartiles, and minimum and maximum of the number of indels per genome per population doubling (statistical test used: ANOVA). d Box–whisker plots showing the median, first and third quartiles, and minimum and maximum of the number of SBS per genome per population doubling. Statistical test used: ANOVA. e Top panels: genomic distribution of the observed versus the expected amount of mutations per genome per doubling. Bottom panels: log2 of the ratio between the total number of observed mutations versus the total number of the expected amount of mutations. Asterisks denote statistically significant differences between observed and expected (binomial test). CDS coding sequence. f Relative number of SBS per cell type (left circles) and those affecting protein-coding DNA (right circles). Nonsynonymous SBS leads to amino-acid changes, whereas synonymous mutations do not have an effect on the protein sequence. g Top panels: genomic distribution of the observed versus the expected amount of mutations per genome per doubling at promoter and promoter-flanking regions. Error bars represent the standard deviation. Bottom panels: log2 of the ratio between the total number of observed versus the total number of the expected amount of mutations at promoter and promoter-flanking regions. Asterisks denote statistically significant differences between observed and expected.

