Figure 1.
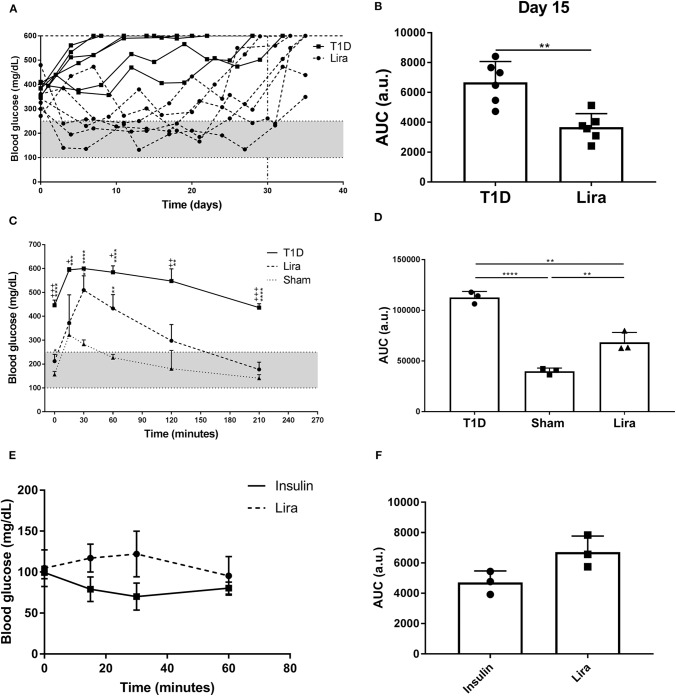
Effect of liraglutide in diabetic immunodeficient NOD.SCID-IL2Rγ−/− (NSG) mice. (A) Two-hour fasting blood glucose levels (mg/dl) in mice rendered diabetic by a single dose of streptozotocin (150 mg/kg) and then treated with daily s.c. injections of liraglutide (Lira responders, circles) and phosphate-buffered saline (T1D, squares) from day 0 to 30 (dashed line). The filled area corresponds to normoglycemia levels in mice. (B) Area under the curve (AUC) of the graph in (A) at day 15, when all animals remain alive. Results are mean ± SD, and differences were found between groups (**p < 0.01, Mann–Whitney test). (C) Intraperitoneal glucose tolerance test in diabetic NSG mice treated with daily s.c. liraglutide for 15 days (Lira, dashed line), non-treated diabetic animals (T1D, continuous line), and normoglycemic mice (sham, dotted line). Statistical differences were found between Lira and T1D groups (+p < 0.05, ++p < 0.01, + + +p < 0.001, Mann–Whitney test) and in both groups when compared to sham (dotted line) (*p < 0.05, **p < 0.01, ***p < 0.001, ****p < 0.0001, Mann–Whitney test). The filled area corresponds to normoglycemia levels in mice. (D) AUC of the graph in (C). The results are mean ± SD, and differences were found between groups (**p < 0.01, ****p < 0.0001, Mann–Whitney test). (E) Insulin tolerance test performed in normoglycemic mice injected with Lira (1 mg/kg, dashed line) or insulin (0.5 U/kg, continuous line). (F) AUC of the graph in (E). The results are mean ± SD; no statistical differences were found between groups.

