Figure 4.
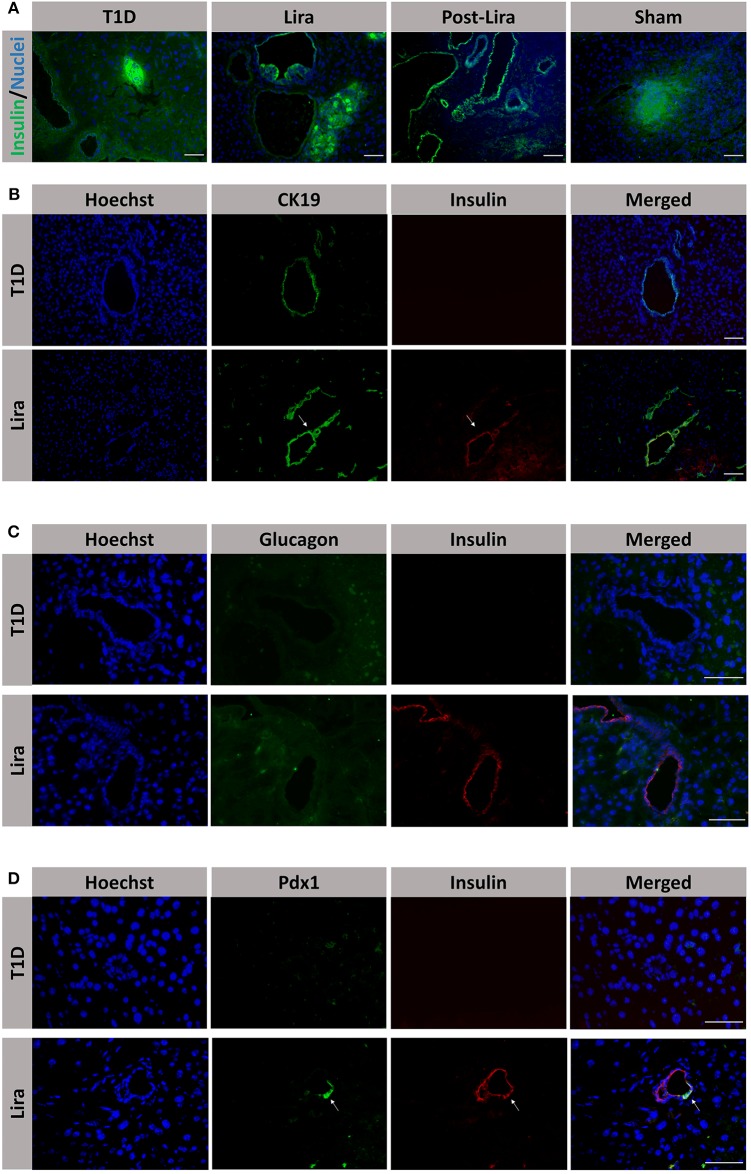
Assessment of the effect of liraglutide in the induction of insulin-expressing ducts. (A) Staining for β-cells in the pancreas of immunodeficient NOD.SCID-IL2Rγ−/− (NSG) mice rendered diabetic by streptozotocin and treated with phosphate-buffered saline (PBS; T1D), or with liraglutide for 48 h (Lira 48 h), for 7–15 days (Lira) and after the withdrawal of liraglutide at day 30 (post-Lira). The Lira and post-Lira groups show the presence of neo-islets emerging from the ducts. Normoglycemic mice were included as control (sham). (B) Staining for ductal cells (CK19, green) and β-cells (insulin, red) in the same groups than in (A). The white arrow depicts a CK19+ duct that is positive for insulin expression. (C) Staining for glucagon (green) and insulin (red) in ductal cells of animals treated with liraglutide for 7–15 days (Lira). (D) Staining for Pdx1 (green) and insulin (red) in the ductal part of diabetic NSG mice treated with PBS (T1D) or liraglutide for 7–15 days (Lira). The white arrows depict positivity for both Pdx1 and insulin in the ducts. The nuclei in all pictures are stained with Hoechst (blue). The scale bar in all pictures indicates 50 μm.

