FIGURE 3.
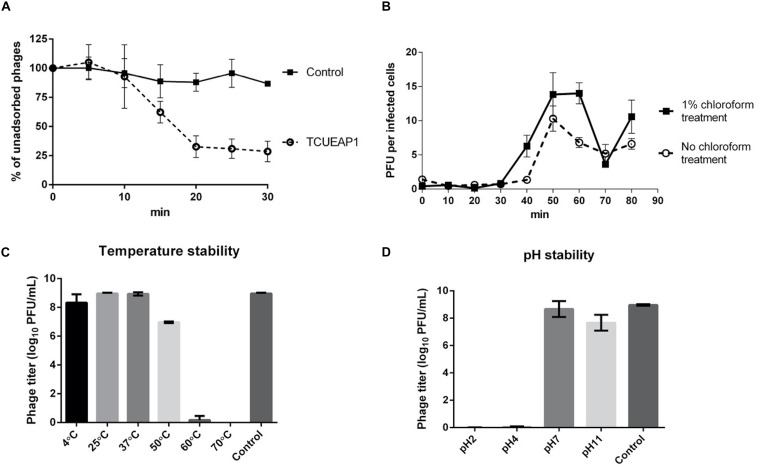
Characterization of TCUEAP1. (A) Adsorption curve of the phage TCUEAP1 to the host E. anophelis ANO15 and the control E. meningoseptica BCRC 10677 at an MOI of 1 at 25°C. Aliquots were taken at intervals of 5 min (up to 30 min), and the supernatant containing the non-adsorbed phages were titrated. Percentage unadsorbed phages is the ratio of the phage titer in the supernatant to that in the initial phage stock. (B) One-step growth curve of the phage TCUEAP1 on E. anophelis ANO15 at 25°C. PFU per infected cells in chloroform-treated and chloroform-untreated cultures are shown at different time points. (C) The effect of temperature. TCUEAP1 was incubated at different temperature values for 1 h before determining the phage titer. (D) The effect of pH on TCUEAP1. TCUEAP1 was incubated at different pH values for 1 h before determining the phage titer. All experiments were repeated three times.

