Figure 3.

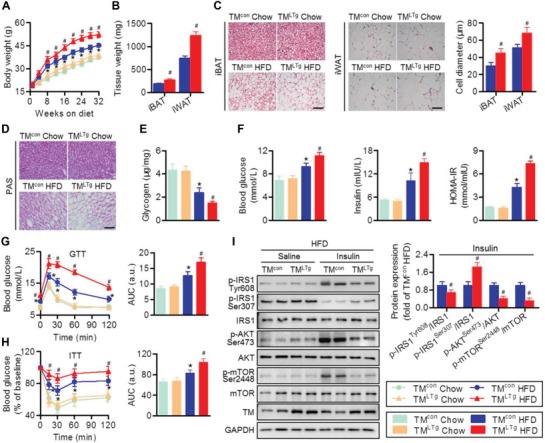
Hepatocyte TMEM16A aggravates HFD‐induced obesity and insulin resistance. A) Body weight of TMLTg and TMcon mice on the indicated diets for 32 weeks. *P < 0.05 versus TMcon chow, #P < 0.05 versus TMcon HFD, n = 15–20 per group. B) Weight of iBAT and iWAT of TMcon and TMLTg mice after HFD treatment. #P < 0.05 versus TMcon HFD, n = 8 per group. C) Representative images of H&E staining of iBAT and iWAT. Adipocyte diameter was calculated. Scale bar, 50 µm. #P < 0.05 versus TMcon HFD, n = 8 per group. D) PAS staining representative images of liver sections of TMcon and TMLTg mice on the indicated diets, n = 4 per group. Scale bar, 50 µm. E,F) Hepatic glycogen content (E), fasting blood glucose, fasting insulin, and HOMA‐IR index (F) in TMcon and TMLTg mice on the indicated diets for 32 weeks. *P < 0.05 versus TMcon chow, #P < 0.05 versus TMcon HFD, n = 12 per group. G,H) GTT (G) and ITT (H) were performed on TMcon and TMLTg mice after 32 weeks on the indicated diets. *P < 0.05 versus TMcon chow, #P < 0.05 versus TMcon HFD, n = 14 per group. I) Phosphorylation of IRS1 (Tyr608, Ser307), AKT (Ser473), and mTOR (Ser2448) in response to an intraperitoneal injection of saline or insulin (1.0 IU kg−1 for 15 min) in the liver tissues of TMcon and TMLTg mice after being fed with HFD. #P < 0.05 versus TMcon insulin, n = 6 per group.
