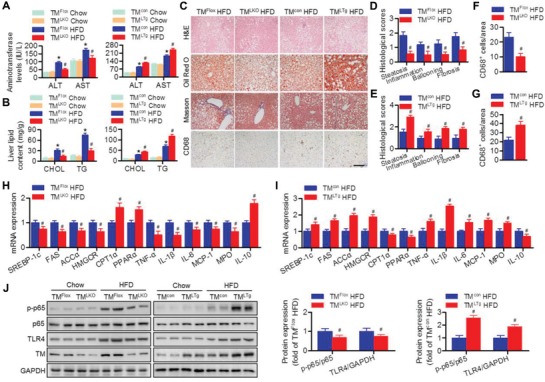
Figure 4.

Hepatocyte TMEM16A promotes HFD‐induced hepatic steatosis and inflammation. A,B) Plasma ALT and AST (A), and hepatic cholesterol (CHOL) and triglyceride (TG) (B) levels in TMLKO mice, TMLTg mice, and their control littermates on the indicated diets for 32 weeks. *P < 0.05 versus TMFlox chow or TMcon chow, #P < 0.05 versus TMFlox HFD or TMcon HFD, n = 8–12 per group. C–G) Representative H&E, Oil Red O, Masson's trichrome, and CD68 staining of liver sections of TMLKO mice, TMLTg mice, and their control littermates after 32 weeks of HFD (C). Quantification of histological scores (D,E) and CD68‐positive macrophages (F,G). Scale bar, 100 µm. #P < 0.05 versus TMFlox HFD or TMcon HFD, n = 6–8 per group. H–J) mRNA levels of genes associated with cholesterol synthesis, fatty acid synthesis, fatty acid oxidation, and inflammatory response (H,I) as well as p65 phosphorylation and TLR4 protein expression (J) levels in the livers of TMLKO mice, TMLTg mice, and their control littermates fed with the indicated diets for 32 weeks. #P < 0.05 versus TMFlox HFD or TMcon HFD, n = 6 per group.
