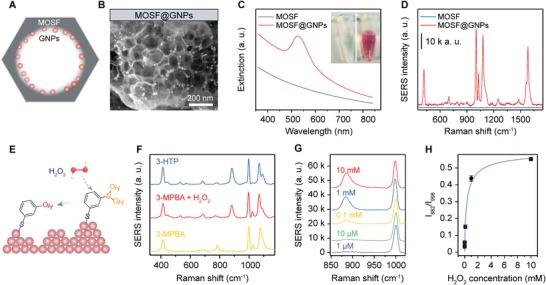
Figure 1.

A) Scheme and B) SEM image of MOSF@GNPs. C) UV–vis extinction spectra of MOSF and MOSF@GNPs in water. D) SERS response of 3‐MPBA adsorbed on MOSF@GNPs. E) Scheme showing oxidation of 3‐MPBA to 3‐HTP by H2O2 at GNP surface. F) SERS spectra of 3‐HTP and 3‐MPBA before and after addition of H2O2. G) SERS spectra of 3‐MPBA recorded from surface of MOSF@GNPs as a function of H2O2 concentration. H) Peak intensity ratios (I 882/I 998) of the spectra shown in (G) as a function of H2O2 concentration. The error bars represent the standard deviation obtained from the mean of triplicate measurements.
