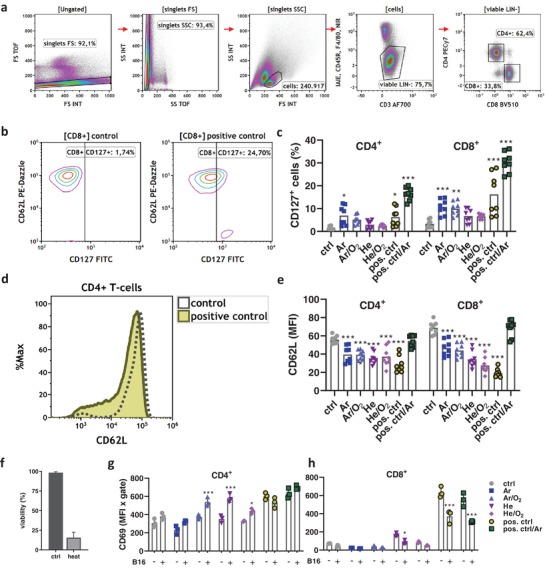
Figure 3.

Plasma treatment of murine syngeneic melanomas increased T‐cell activation. a) Flow cytometry gating strategy to investigate CD4+ and CD8+ T‐cells from secondary lymphoid organs of tumor‐bearing mice; b) representative contour plots for CD62L and CD127 in CD8+ T‐cells from control and positive control animals; c) quantification of CD127 in CD4+ and CD8+ T‐cells from lymph nodes and splenocytes of tumor‐bearing mice; d) representative overlay histogram of CD62L expression on CD4+ T‐cells from control and positive control of tumor‐bearing mice; e) quantification of CD62L in CD4+ and CD8+ T‐cells from lymph nodes and splenocytes; f) viability of B16F10 cells in control conditions or after heat inactivation (65 °C for 3 min) as determined by flow cytometry; g,h) quantification of CD69 expression on CD4+ (f) and CD8+ (g) T‐cells from splenocytes of tumor‐bearing mice in presence or absence of B16F10 melanoma cells for 18 h. Data are mean ± SEM from secondary lymphoid organs extracted from animal experiments shown in Figure 2. Statistical comparison was performed using ANOVA against control (ctrl) group (c,e) or multiple t‐tests of cells in the presence (+) and absence (−) of melanoma cells (g,h).
