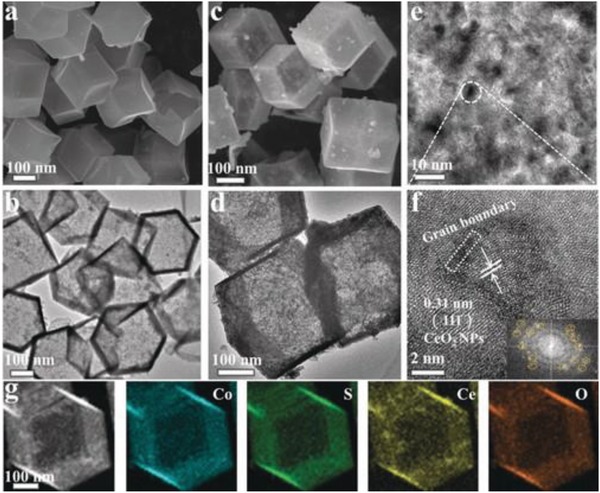
Figure 11.

a–d) SEM and TEM images for CoS and 14.6 % CeOx/CoS. e,f) The HRTEM images and corresponding SAED pattern (the inset in (f)) of 14.6 % CeOx/CoS. g) Elemental mapping images of 14.6 % CeOx/CoS. Reproduced with permission.251 Copyright 2018, Wiley‐VCH.
