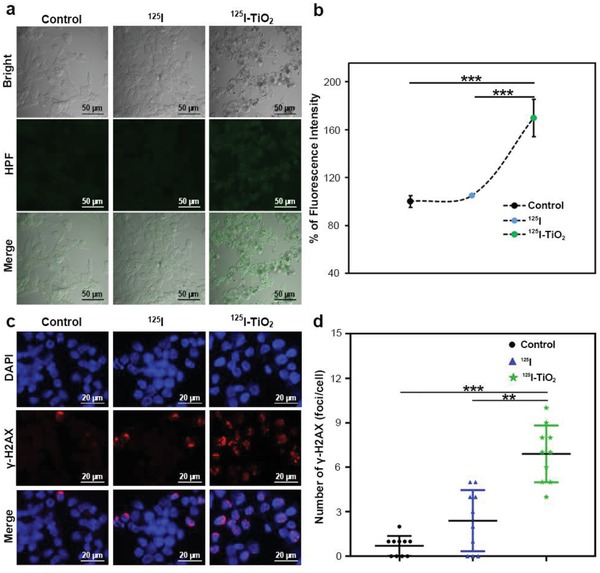
Figure 4.

In vitro cell experiments exploring the mechanism for enhanced therapeutic effects. a) Fluorescence assay analyzing intracellular •OH generation after different treatments of DMEM (control), 125I and 125I‐TiO2. b) Quantitative comparison of •OH yield among groups (n = 3, mean ± s.d., one‐way ANOVA with LSD‐t post hoc test, P < 0. 0001 (125I‐TiO2 vs 125I) and = 0.0002 (125I‐TiO2 vs Control), ***P < 0.001). c) Immunofluorescence assay analyzing DNA DSBs by γ‐H2AX staining in DMEM (control), 125I, and 125I‐TiO2 groups. d) Quantitative comparison of DNA DSBs‐related red fluorescent foci of γ‐H2AX among groups (n = 10, mean ± s.d., Kruskal–Wallis one‐way ANOVA analysis, P = 0.002 (125I‐TiO2 vs 125I) and <0.001 (125I‐TiO2 vs Control), **P < 0.01, ***P < 0.001).
