Figure 5.

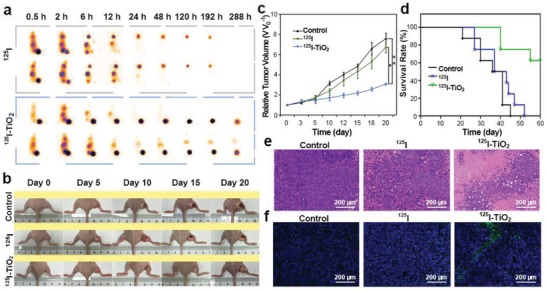
In vivo imaging and therapeutic assessment. a) Representative SPECT/CT images of SW1990 tumor‐bearing mice at different time points after intratumoral injection of 125I and 125I‐TiO2. b) Representative photographs of SW1990 tumor‐bearing mice for time‐course change of tumor size after different treatments including DMEM (control), 125I, and 125I‐TiO2. c) Tumor growth curves during the 20 d observation after different treatments by DMEM (control), 125I, and 125I‐TiO2. Relative tumor volume (V V 0 −1) was given by tumor volume (V) normalized to the initial value (V 0) (n = 5, mean ± s.d., Kruskal–Wallis one‐way ANOVA analysis, P = 0.048 (125I‐TiO2 vs 125I) and 0.001 (125I‐TiO2 vs Control), *P < 0.05, **P < 0.01). d) Survival curves of mice after different treatments during an observation period of 60 d (n = 8). e) H&E staining of tumor sections harvested at day 20 post different treatments (original magnification 200 ×). f) Representative TUNEL staining of tumor slices collected at day 20 post treatments (original magnification 200 ×).
