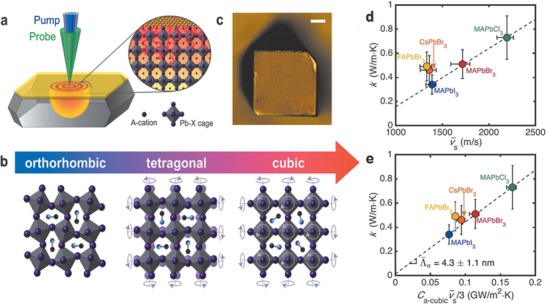
Figure 6.

a) Schematic of the FDTR measurement on an Au‐coated perovskite single crystal. A pump laser (blue) heats the crystal while a probe laser (green) measures the temperature‐dependent reflectance of Au to determine the κ of the crystal. b) Common phase transitions of the perovskite lattice, shown for MAPbX3. In the tetragonal and cubic phases, the MA cations are under constant motion within the lattice and are therefore shown in random orientations. The purple arrows in these phases illustrate some of the many possible octahedron motions of the system under dynamic disorder. c) Optical microscope image of a CsPbBr3 crystal with an Au transducer layer evaporated on top. Scale bar is 50 µm. d) κ as a function of sound speed (v̅s). e) κ as a function of Ca‑cubic v̅s/3, where Ca‑cubic is the volumetric heat capacity of acoustic phonons based on a cubic unit cell. Reproduced with permission.[ 86 ] Copyright 2017, American Chemical Society.
