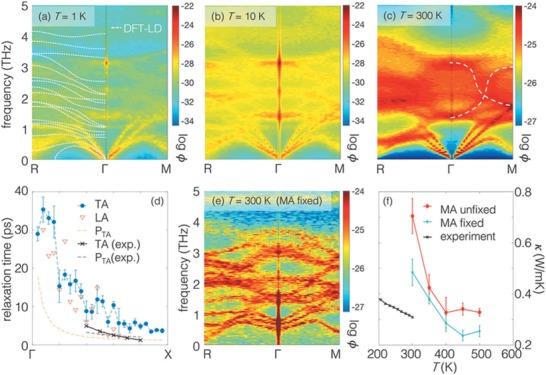
Figure 7.

a–c) Spectral energy density of dynamical modes in MAPbI3 at different temperatures from ab initio molecular dynamics. The dotted white line for T = 1 K shows the lattice dynamics result for comparison. The band line‐widths broaden as temperature increases. At T = 300 K, the vibrational modes between 3–4 THz that are well‐defined at low temperatures are now heavily blurred. d) The modal relaxation time extracted from SED compared to recent experimental measurements. The relaxation time is close to the wave period for each thermal carrier, suggesting the conventional phonon picture is not an adequate description of the carriers. e) Freezing the rotations of the MA molecules recovers the well‐defined lattice dynamical modes, which suggests that interactions between the inorganic framework and sublattice MA orientational disorder are responsible for the loss of wave nature in (c). f) κ calculated via Green–Kubo formalism using classical molecular dynamics, with MA fixed and unfixed, compared with experiments. Reproduced with permission.[ 97 ] Copyright 2018, Royal Society of Chemistry.
