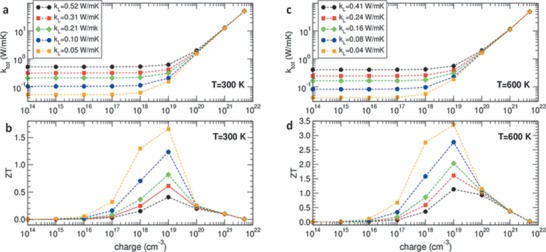
Figure 8.

Total κ = κel + κl (a,c) and the dimensional figure of merit ZT (b,d) versus charge concentration for electron‐doped MAPbI3, calculated at two different temperatures; κl is extrapolated from the experimental data published elsewhere. Black dots and red squares correspond to the experimental κl values for single crystal MAPbI3 and poly crystal MAPbI3, respectively; the other symbols are for rescaled κl values (indicated in the legend), mimicking eventual κ suppression occurring in 2D wells of thickness L = 40 nm (green diamonds), 20 nm (blue circles), and 10 nm (orange squares). Reproduced with permission.[ 131 ] Copyright 2014, American Chemical Society.
