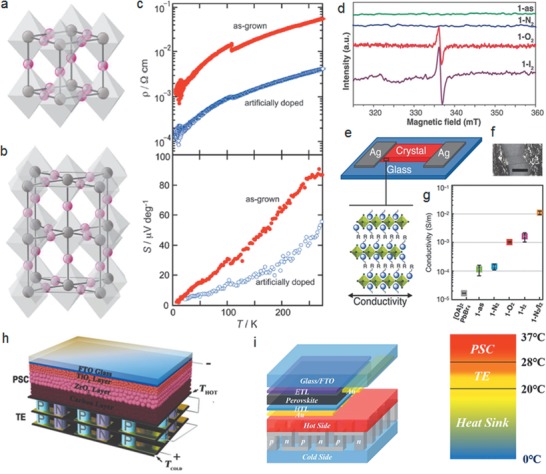
Figure 11.

Crystal structure of MASnI3 at a) 295 K and b) 140 K. Sn is represented by the gray spheres and I by the pink spheres. MA cations are disordered and are not included. c) Change in the electrical resistivity and thermoelectric power caused by intentional doping. Reproduced with permission.[ 145 ] Copyright 2011, Royal Society of Chemistry. d) X‐band electron paramagnetic resonance (EPR) of solid crystalline samples of 1‐as, 1‐N2, 1‐O2, and 1‐I2 at 77 K. e) The experimental setup used for single crystal electrical conductivity measurements and representation of the layered hybrid perovskites orientation showing the direction of conductivity measurements. f) Microphotograph showing a device made with a single crystal of 1‐ as; scale bar: 4 mm. g) Averaged values and standard uncertainties for in‐plane conductivity of [OA]2PbBr4, 1‐as, 1‐N2, 1‐O2, 1‐I2, and 1‐N2/I2 at 423 K. Reproduced with permission.[ 146 ] Copyright 2018, Wiley‐VCH. h) Device architecture of perovskite photovoltaic‐Thermoelectric (PV‐TE) hybrid device with carbon top electrode. Reproduced with permission.[ 147 ] Copyright 2018, Wiley‐VCH. i) Schematic device architecture of PV‐TE hybrid device with gold top electrode. Also shown is the simulated heat variation in the vertical direction of the PV‐TE hybrid system. Reproduced with permission.[ 148 ] Copyright 2019, Elsevier.
