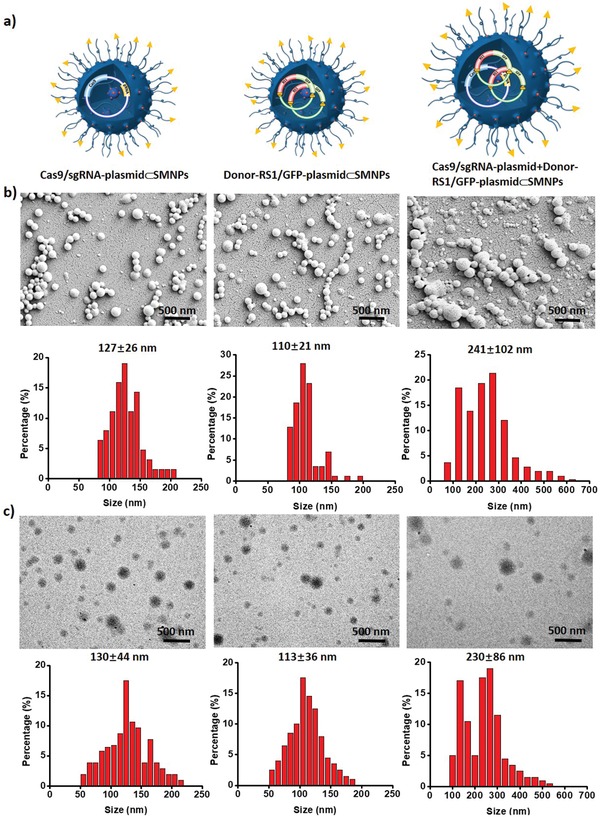
Figure 3.

a) Schematic illustrations of optimal Cas9/sgRNA‐plasmid⊂SMNPs, Donor‐RS1/GFP‐plasmid⊂SMNPs, and the coencapsulated Cas9/sgRNA‐plasmid+Donor‐RS1/GFP‐plasmid⊂SMNPs. b) Scanning electron microscopy (SEM) and c) transmission electron microscopy (TEM) images summarize the size distributions of these three SMNPs. The size distributions of SMNPs in the TEM and SEM images were measured via Nano measure 1.2 software. More than 200 SMNPs were counted in each sample.
