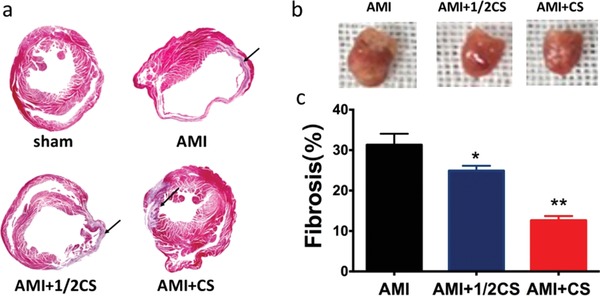
Figure S7.

Effect of “ion therapy” of different concentrations on heart remodeling as well as hypertrophy post AMI in vivo. a) Representative Masson's trichrome staining of heart sections evaluating collagen deposition 4 weeks after surgery. c) Quantitative analysis of the area of fibrosis. Sham group was set as 0% and #P < 0.001 vs. AMI group (5 pictures for each group). b) Representative pictures of heart samples indicating hypertrophy degrees. *P < 0.05 vs. AMI group, **P < 0.01 vs. AMI group. Sham group n = 3; AMI group n = 3; AMI+1/2CS1 group n = 3 and AMI+ CS group n = 3; mean ± SD.
