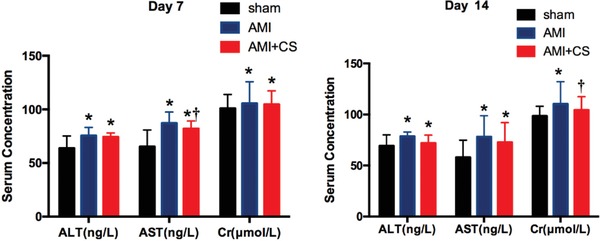
Figure 10.

Bio‐distribution and metabolism of Si and acute toxicity of “ion therapy.” g) Serum expression of ALT, AST, and Cr level in each groups after injection for 7 d. h) Serum expression of ALT, AST, and Cr level in each groups after injection for 14 d. Sham group n = 4; AMI group n = 7 and AMI+CS group n = 13. *p < 0.05 versus sham group or day 0, **p < 0.01 versus Day 0, †p < 0.05 versus AMI group; mean ± SD.
