
Figure 1.
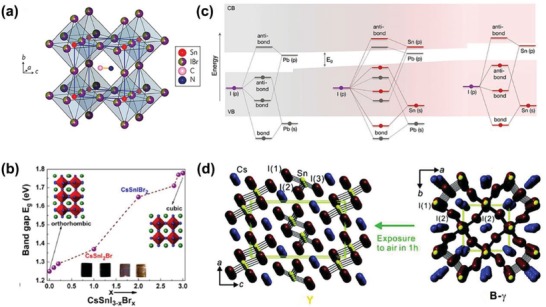
a) Crystal structure of CH3NH3SnI3− xBrx perovskite. Reproduced with permission.[ 34 ] Copyright 2014, Nature Publishing Group. b) Bandgap variation with Br− concentration. Reproduce with permission.[ 43 ] Copyright 2015, American Chemical Society Publications. c) Schematic representation of the origin of the bandgap in MAPbI3, MA(Pb0.75Sn0.25)I3, MA(Pb0.25Sn0.75)I3, MASnI3.The shaded area indicates the valence band and the conduction band, and the thick line indicates the molecular orbital map. Reproduce with permission.[ 46 ] Copyright 2018, American Chemical Society Publications. d) The crystal structure changes from orthorhombic (B‐γ) to yellow (Y) after exposure to air at 300 K. Reproduce with permission.[ 51 ] Copyright 2012, American Chemical Society Publications.