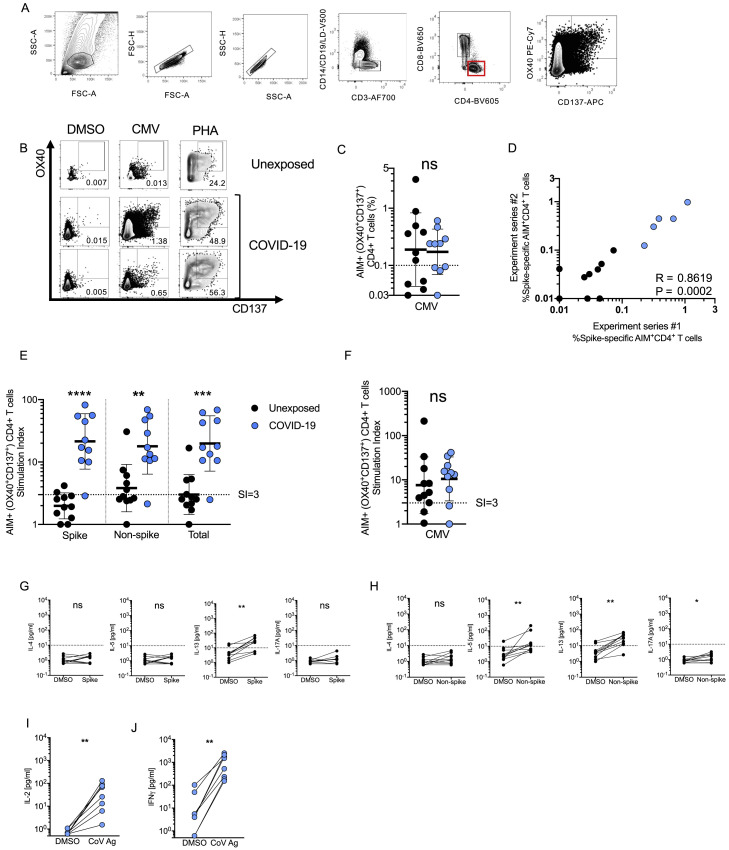
Figure S3.
SARS-CoV-2-Specific CD4+ T Cell Responses of Recovered COVID-19 Patients, Related to Figure 2
(A) Example flow cytometry gating strategy.
(B) FACS plot examples for controls. DMSO negative control, CMV positive control, PHA positive control.
(C) CMV-specific CD4+ T cells as percentage of AIM+ (OX40+CD137+) CD4+ T cells after stimulation of PBMCs with CMV peptide pool. Data were background subtracted against DMSO negative control and are shown with geometric mean and geometric standard deviation. Samples were from unexposed donors (“Unexposed,” n = 11) and recovered COVID-19 patients (“COVID-19,” n = 10).
(D) Spearman correlation of SARS-CoV-2 spike−specific CD4+ T cells (AIM+ (OX40+CD137+) CD4+ T cells, background subtracted) after stimulation with spike pool run on the same donors in two independent experiment series run on different dates. COVID-19 patient samples shown in blue. Unexposed donor samples shown in black.
(E-F) Stimulation index quantitation of AIM+ (OX40+CD137+) CD4+ T cells; the same samples as in Figure 2 and Figure S3C were analyzed.
(G-H) Cytokine levels in the supernatants of AIM assays after stimulation with (G) Spike MP (MP_S), or (H) CD4-R (“Non-spike”). Data are shown in comparison to the negative control (DMSO), per donor.
(I-J) Cytokine production by CD4+ T cells in response to Non-spike (CD4-R MP) or Spike (MP_S) peptide pools (“CoV antigen (Ag)”) was confirmed by analyzing cytokine secretion from the subset of COVID-19 donors determined to have low or negative CD8+ T cell responses (< 0.1% by AIM) to the same peptide pool determined positive for SARS-CoV-2−specific CD4+ T cells by AIM. (I) IL-2. (J) IFNγ.
Statistical comparisons across cohorts were performed with the Mann-Whitney test, while paired sample comparisons were performed with the Wilcoxon test. ∗∗p < 0.01; ∗∗∗p < 0.001. ns not significant.

