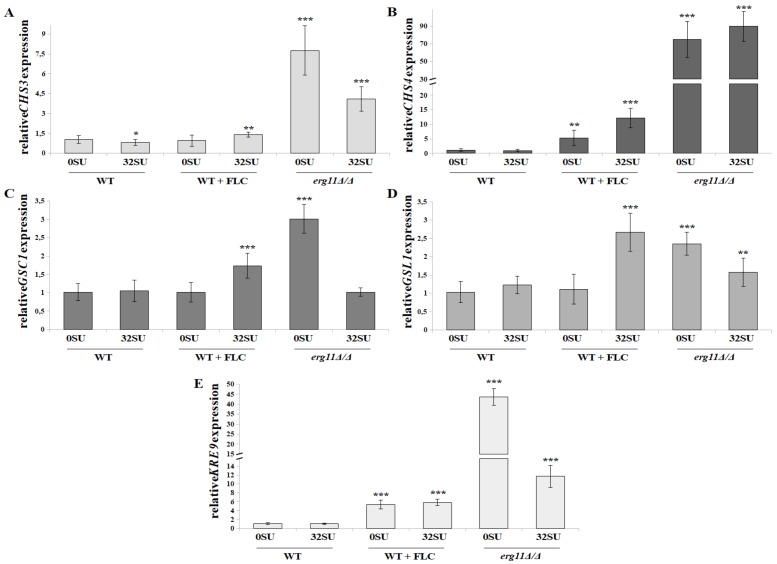
Figure 6.
Relative CHS3 (A), CHS4 (B), GSC1 (C), GSL1 (D) or KRE9 (E) gene expression in C. albicans treated with 32 µg/mL SU. The following cell types were treated under the following conditions: C. albicans CAF2-1 strain (WT), C. albicans CAF2-1 strain simultaneously treated with 1 µg/mL fluconazole (WT + FLC) and C. albicans KS028 strain (erg11Δ/Δ mutant). Gene expression levels are reported as means of 2−∆∆CT values (n = 6) ± SD; normalized to 1 for untreated CAF2-1 strain (WT 0SU). Statistical analyses were performed by comparing expression under each condition to a untreated CAF2-1 strain (WT 0SU) (*, p < 0.05; **, p < 0.01; ***, p < 0.001).

