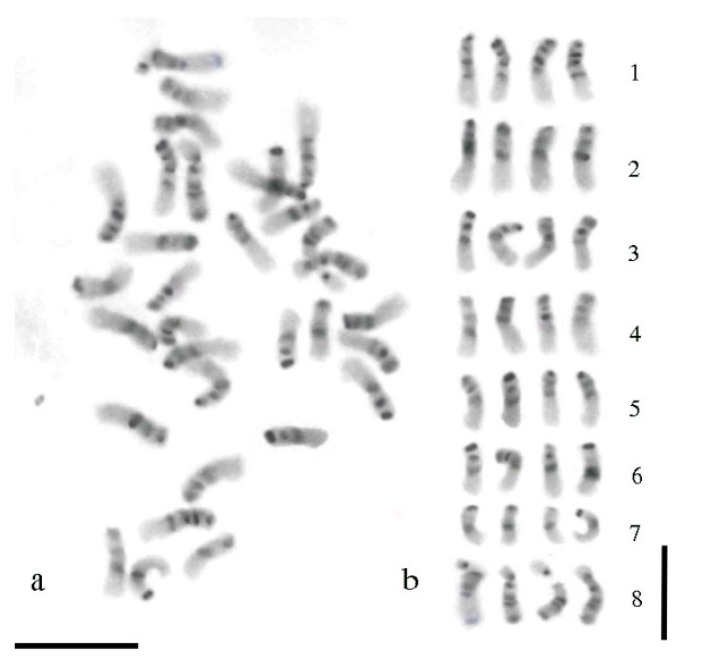
Figure 2.
C-banding in the tetraploid alfalfa. (a) Mitotic metaphase chromosomes after the C-banding treatment and Giemsa staining; (b) karyogram according to Figure 1a; chromosomes were arranged according to their morphological traits and distribution of the heterochromatic bands. The bar represents 5 µm.

