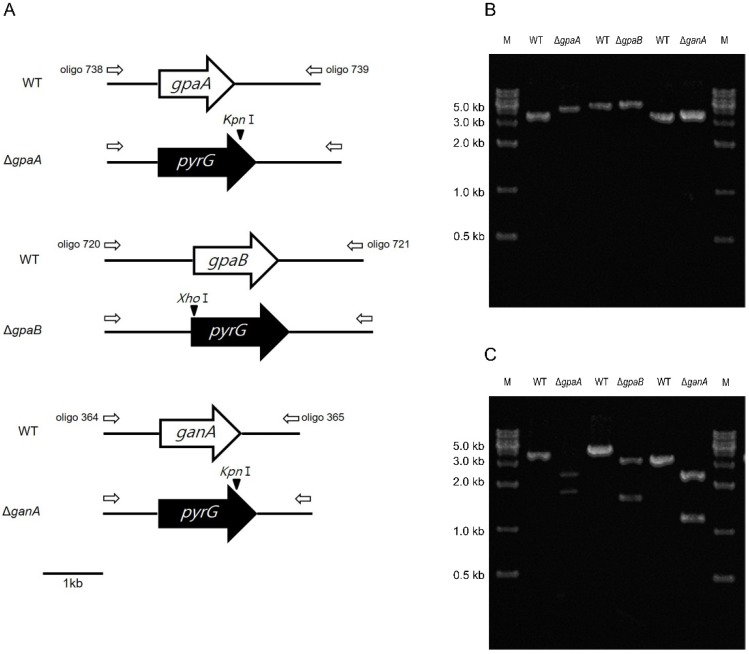
Figure 2.
Verification of ΔgpaA, ΔgpaB, and ΔganA. (A) Schematic illustration of the gpaA, gpaB, and ganA regions and restriction maps of WT and mutant strains. (B) PCR amplicons for the three strains compared to that of WT. Lane M, molecular weight marker. (C) The KpnI (for ΔgpaA and ΔganA) and XhoI (for ΔgpaB) digestion patterns of individual amplicons. While the mutant amplicons are cut into two fragments, the WT amplicon remains uncut.

