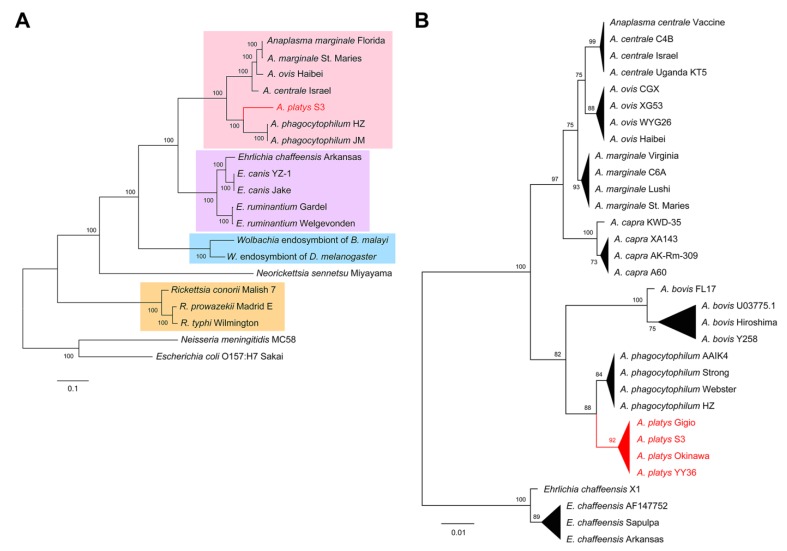
Figure 3.
Evolutionary position of A. platys. (A) ML trees built from concatenated amino acid sequences of conserved genes from the species included in the genome completeness analysis (Figure 2). Branches grouping Anaplasma, Ehrlichia, Wolbachia, and Rickettsia species were respectively highlighted in pink, purple, blue, and orange. (B) ML tree built from the nucleotide sequences of 16S rRNA genes of four representative strains/isolates for seven Anaplasma species, using E. chaffeensis as an outgroup.

