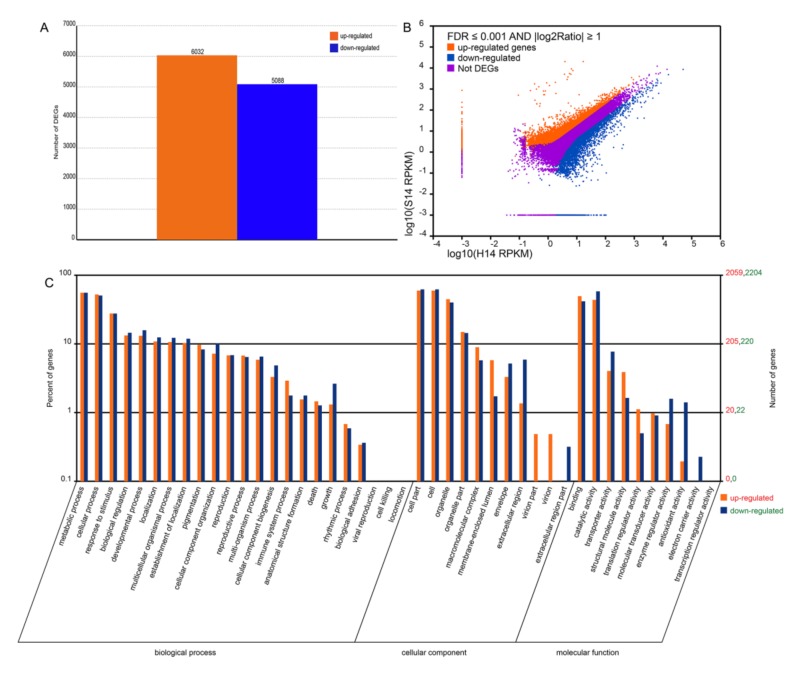
Figure 5.
Comparison of the transcriptomes of non-infected and SPFMV and SPCSV-infected sweet potato plants H14 and S14. (A) The number of differentially expressed genes (DEGs) between non-infected (H14) and infected sweet potato plants (S14). The height of the bar shows the number of genes that are differentially expressed between H14 and S14. Upregulated expression is indicated in orange and downregulated expression in blue. (B) Gene expression levels in H14 and S14. Upregulated genes are shown as orange bars, downregulated genes as blue bars, and non-DEGs as purple bars. (C) Gene ontology (GO) categories of the DEGs. The heights of the bars show the number of DEGs in the specified GO categories. Upregulated categories are presented in orange and downregulated categories in blue.

